Order Flow charts dated 26th Feb 2020 (5 mins)

Order Flow trading is thinking about what order market participants do and when you think along this, you can anticipate what kind of action they will be taking in the market. This is a very important concept in Order Flow. NF BNF
Market Profile Analysis dated 25th Feb 2020
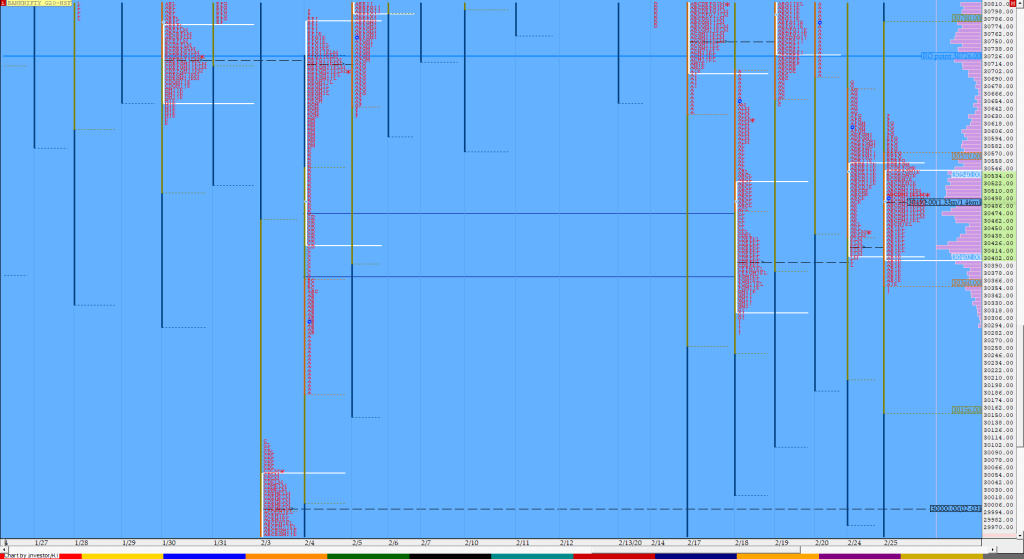
Nifty Feb F: 11827 [ 11970 / 11814 ] HVNs – hvns at 11830-842 / 11930-934 / 12012 / 12080 / 12111 / 12130 / 12162 / (12220) Previous day’s report ended with this ‘Spike rules would apply for the next session with the spike zone being from 11837 to 11814 which if taken out, […]
Participantwise Open Interest – 25th FEB 2020
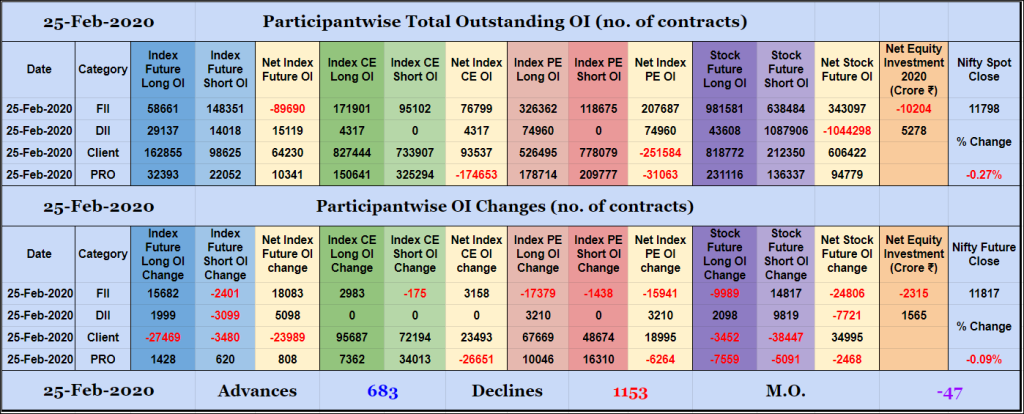
FIIs added 15K long Index Futures, 2K long Index CE and 14K short Stocks Futures contracts today besides covering 2K short Index Futures and liquidating 9K long Stocks Futures contrracts. They were net sellers in equities segment for ₹2315 crore. Clients reduced exposure in Index and Stocks Futures while adding net 23K long Index CE […]
Desi MO (McClellans Oscillator For NSE) – 25th FEB 2020
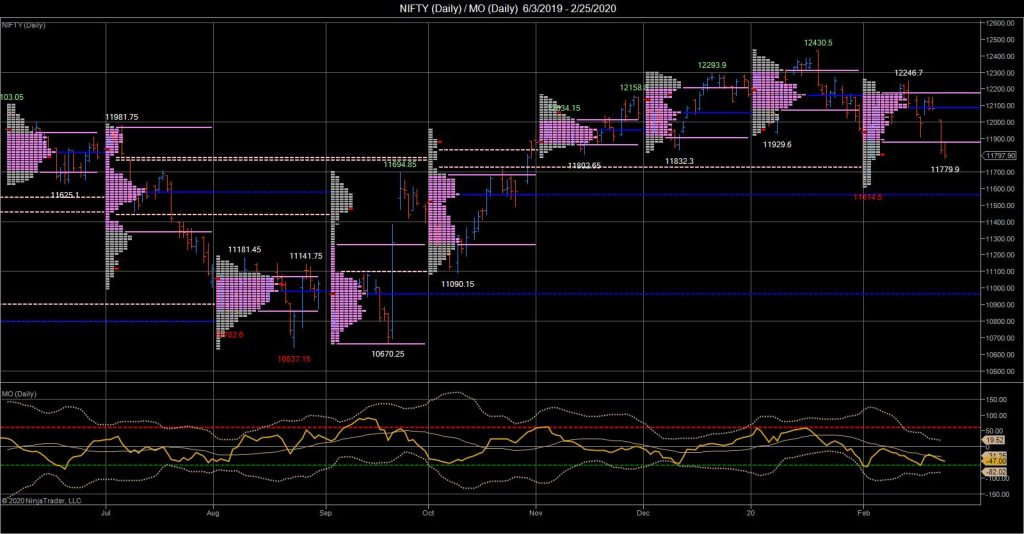
MO at -47
Order Flow charts dated 25th Feb 2020

Many traders are looking for information on how to use market conditions to find good trades. Order Flow is best understood as a way to see existing bias in the markets. Order Flow helps us understand who is in control of the market and who is ‘upside down’ and likely to make exits from that […]
Order Flow charts dated 25th Feb 2020 (5 mins)

The Order Flow approach shows the amount of volume traded during each price bar, and also it breaks this volume down into the Volume generated by the Buyers and the Volume generated by the sellers again at every row of price the market traded at. NF BNF
Market Profile Analysis dated 24th Feb 2020
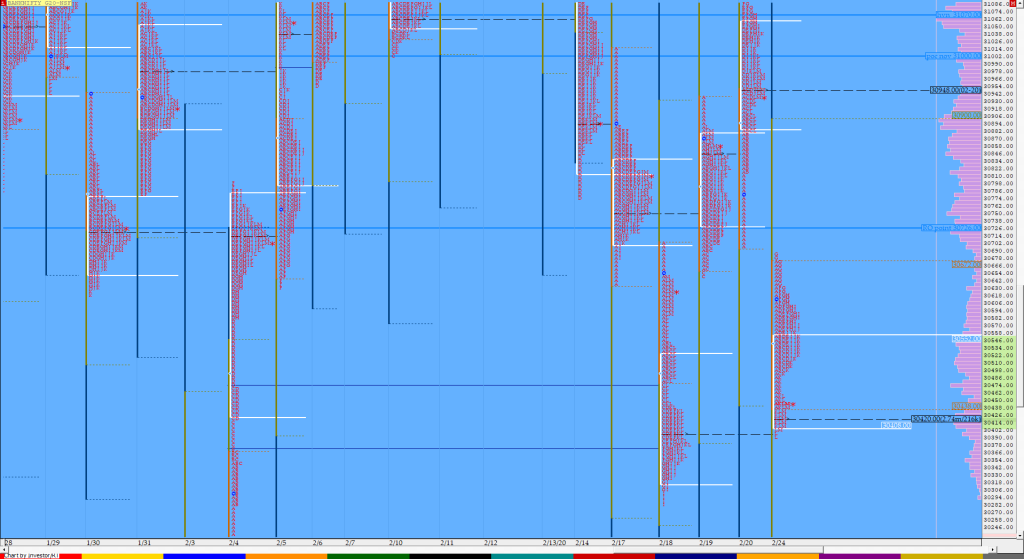
Nifty Feb F: 11827 [ 11970 / 11814 ] HVNs – 11830 / (11898) / 11930 / (11976) / 12012 / 12080 / 12111 / 12130 Previous day’s report ended with this ‘NF closed the day at 12079 but has given a second successive Neutral Extreme profile though in opposite directions leaving a nice 2-day […]
Participantwise Open Interest – 24th FEB 2020
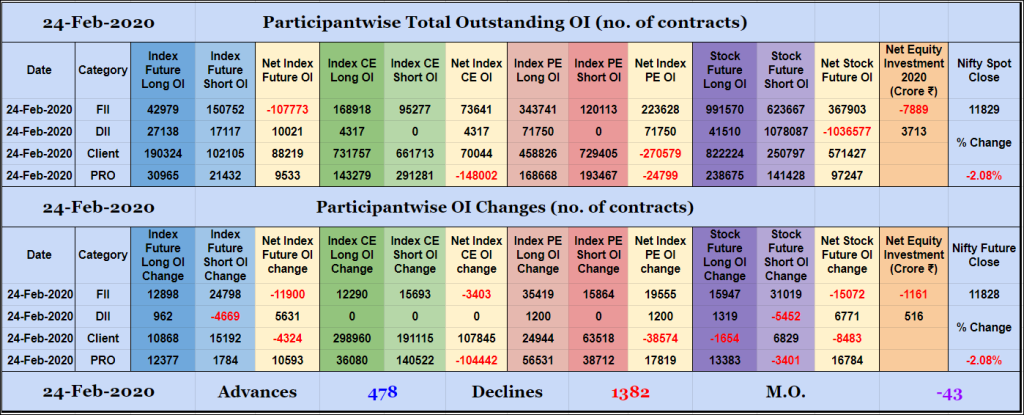
FIIs added net 11K short Index Futures, net 3K short Index CE, net 19K long Index PE and net 15K short Stocks Futures contracts. They were net sellers in equity segment as well for ₹1161 crore. Clients added net 4K short Index Futures, net 107K long Index CE, net 38K short Index PE and 6K […]
Desi MO (McClellans Oscillator For NSE) – 24th FEB 2020
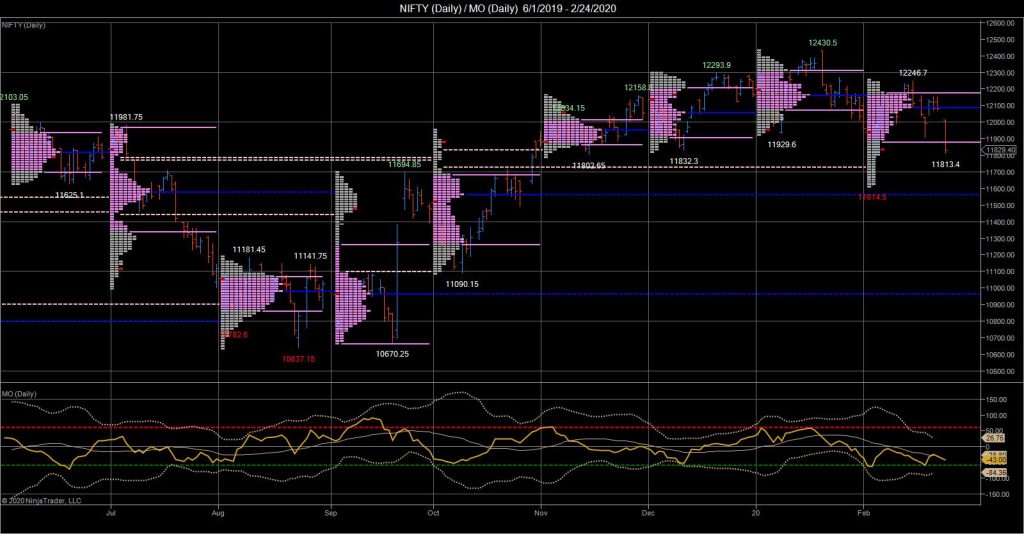
MO at -43
Order Flow charts dated 24th Feb 2020

Many traders are used to viewing volume as a histogram beneath a price chart. This approach shows the amount of volume traded below the price Bar. The Order Flow approach is to see the Volume traded inside or within the price bar, an important distinction. Order Flow trading is thinking about what order market participants […]
