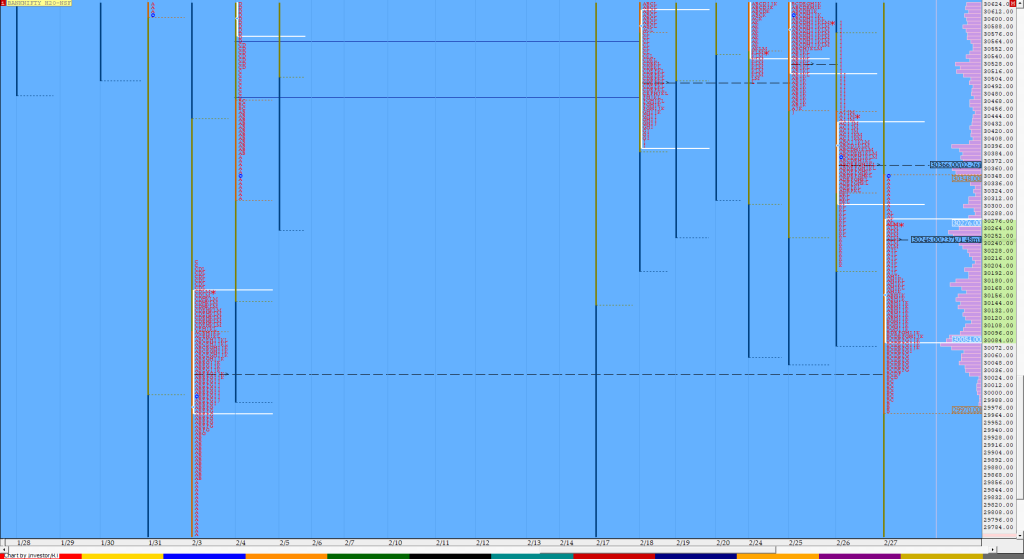
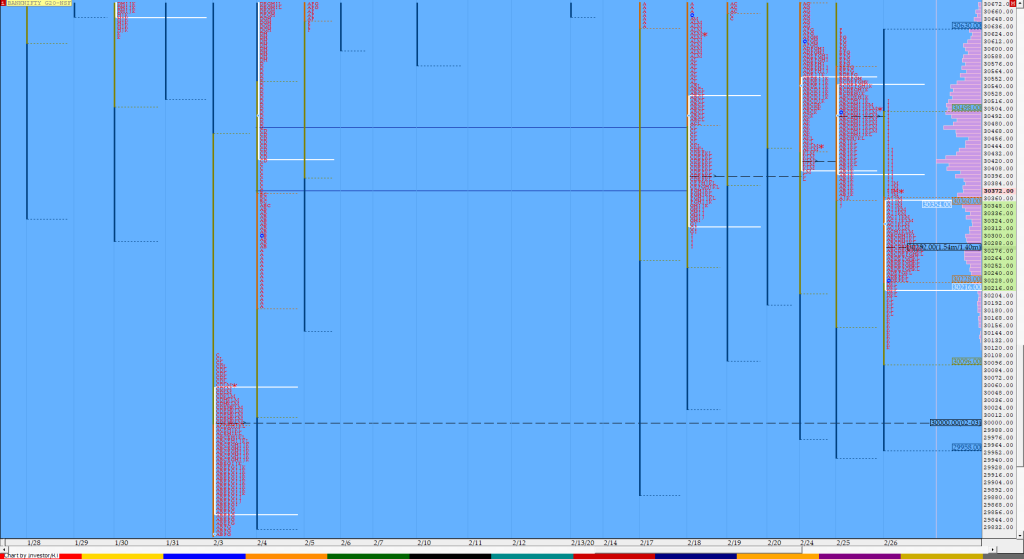
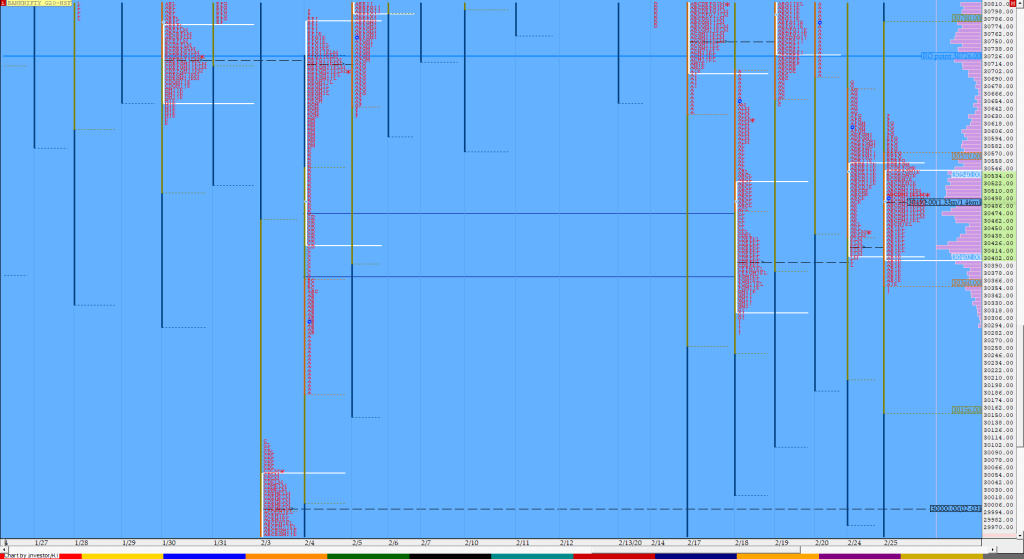
Order Flow charts dated 28th Feb 2020

Trading Order Flow allows a trader to see the specific price where a trade has hit the market, along with the volume of that trade. This information is extremely valuable and allows a trader to generate substantial revenue by using this information to trade. The way we see it is that Order Flow trading is […]
Market Profile Analysis dated 27th Feb 2020

Nifty Mar F: 11629 [ 11685 / 11541 ] HVNs – 11580 / 11610-630 / 11704-730 / 11855 / 11945 NF opened lower which was also an OH (Open=High) start at 11685 after which it gave a drive down on relatively lower volumes but nonetheless went on to make new lows for the month to […]
Order Flow charts dated 27th Feb 2020

Many traders are used to viewing volume as a histogram beneath a price chart. This approach shows the amount of volume traded below the price Bar. The Order Flow approach is to see the Volume traded inside or within the price bar, an important distinction. Order Flow trading is thinking about what order market participants […]
Order Flow charts dated 27th Feb 2020 (5 mins)

The way we see it is that Order Flow trading is a mindset. Well, instead of just looking for technical patterns, Trader should go a step further and think about what other market participants might do. NF (Mar F) BNF (Mar F)
Market Profile Analysis dated 26th Feb 2020

Nifty Feb F: 11695 [ 11788 / 11635 ] HVNs – hvns at 11725 / 11830-842 / 11930-934 / 12012 / 12080 / 12111 / 12130 / 12162 / (12220) NF opened with a big gap down at 11739 and remained weak as it made highs of 11763 in the opening minutes but settled down […]
Order Flow charts dated 26th Feb 2020

A good trader is a one who can make money consistently over a longer period of time. But how to become one such trader, who can make money in any type of market condition? A good trader keeps a close watch on the current information of the market and assesses it for change against previous […]
Order Flow charts dated 26th Feb 2020 (5 mins)

Order Flow trading is thinking about what order market participants do and when you think along this, you can anticipate what kind of action they will be taking in the market. This is a very important concept in Order Flow. NF BNF
Market Profile Analysis dated 25th Feb 2020

Nifty Feb F: 11827 [ 11970 / 11814 ] HVNs – hvns at 11830-842 / 11930-934 / 12012 / 12080 / 12111 / 12130 / 12162 / (12220) Previous day’s report ended with this ‘Spike rules would apply for the next session with the spike zone being from 11837 to 11814 which if taken out, […]
Order Flow charts dated 25th Feb 2020

Many traders are looking for information on how to use market conditions to find good trades. Order Flow is best understood as a way to see existing bias in the markets. Order Flow helps us understand who is in control of the market and who is ‘upside down’ and likely to make exits from that […]
Order Flow charts dated 25th Feb 2020 (5 mins)

The Order Flow approach shows the amount of volume traded during each price bar, and also it breaks this volume down into the Volume generated by the Buyers and the Volume generated by the sellers again at every row of price the market traded at. NF BNF
