Market Profile Analysis dated 28th August
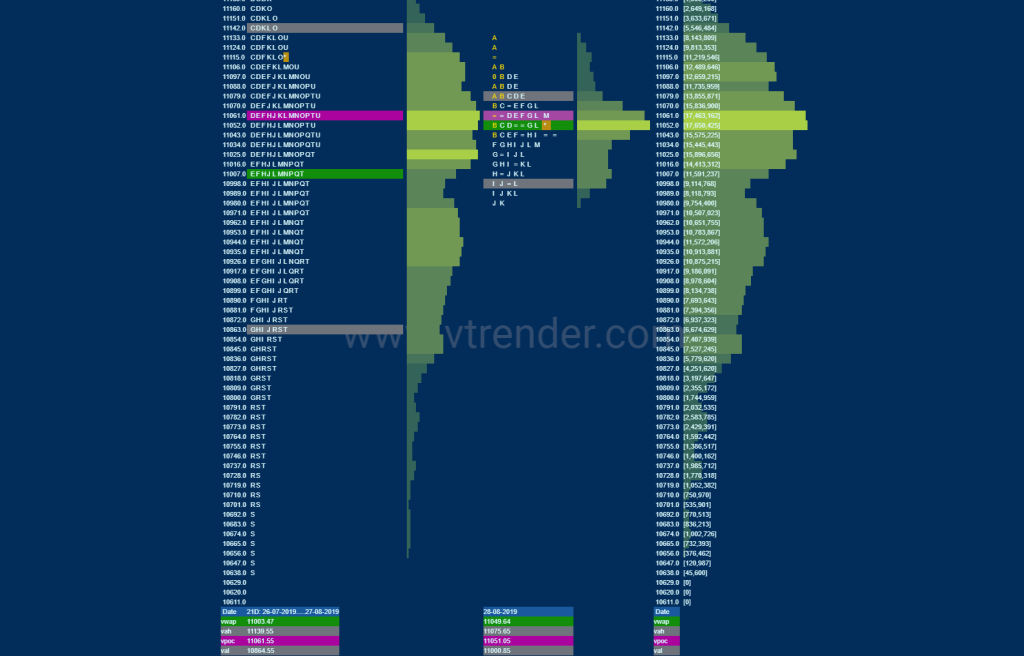
Nifty Aug F: 11049 [ 11132 / 10983 ] As mentioned in the previous report, NF had made a balance at the edge of the monthly composite yesterday and today at open it made an attempt to get above the composite VAH of 11133 which was PDH (Previous Day High) also but was rejected just below […]
Order Flow charts dated 28th Aug
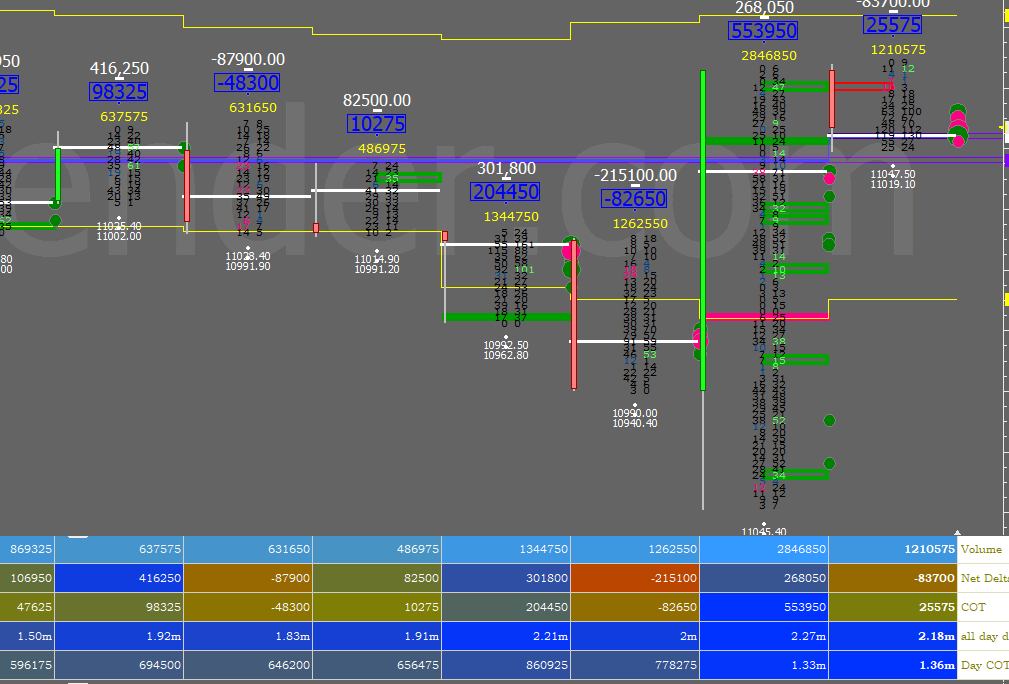
Many traders are looking for information on how to use market conditions to find good trades. Order Flow is best understood as a way to see existing bias in the markets. Order Flow helps us understand who is in control of the market and who is ‘upside down’ and likely to make exits from that […]
Order Flow charts dated 28th Aug (5 mins)
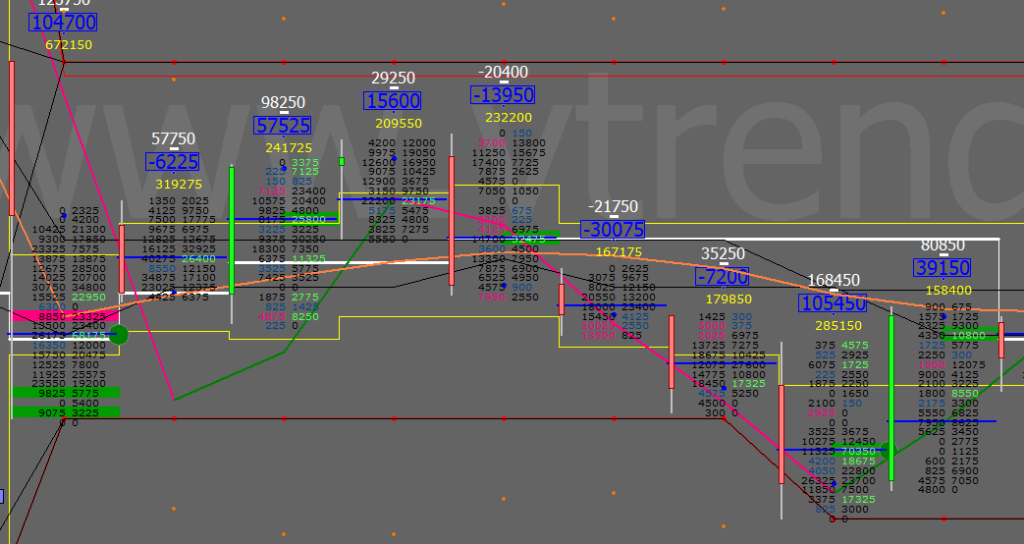
Many traders are used to viewing volume as a histogram beneath a price chart. But the Order Flow approach shows the amount of volume traded during each price bar, and also it breaks this volume down into the Volume generated by the Buyers and the Volume generated by the sellers again at every row of […]
Market Profile Analysis dated 27th August
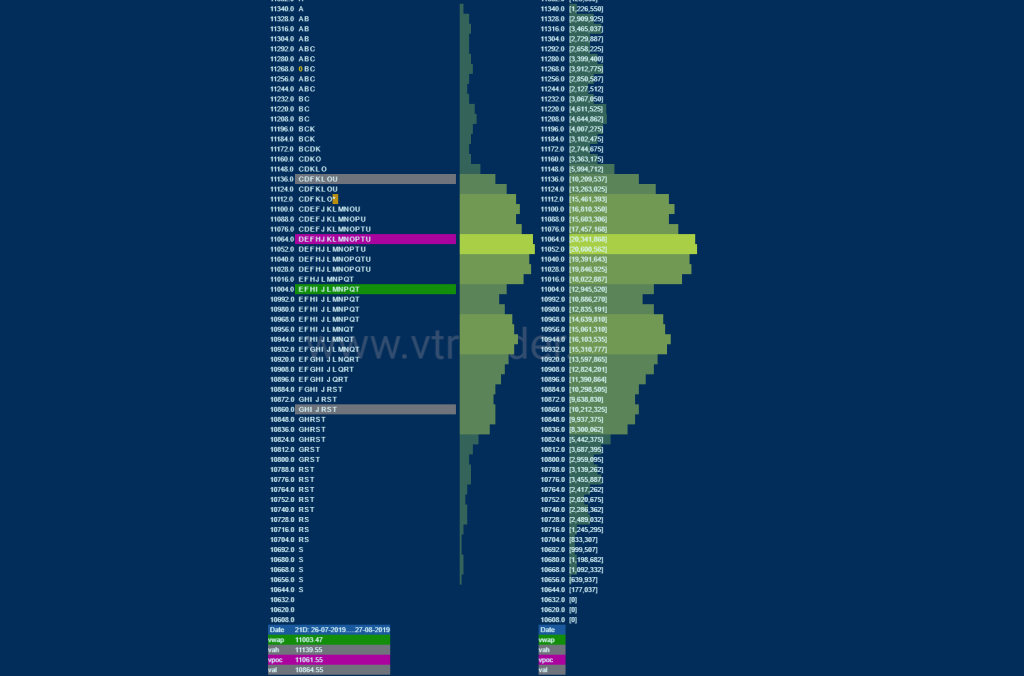
Nifty Aug F: 11104 [ 11133 / 11034 ] NF had left the biggest day in terms of range (327 points) as well as volumes (213 L) of the August series on Monday (26th Aug) and in Market Profile it always happens that ‘Balance follows Imbalance & vice versa’ so after a hat-trick of big range […]
Order Flow charts dated 27th Aug

Many traders are used to viewing volume as a histogram beneath a price chart. But the Order Flow approach shows the amount of volume traded during each price bar, and also it breaks this volume down into the Volume generated by the Buyers and the Volume generated by the sellers again at every row of […]
Order Flow charts dated 27th Aug (5 mins)

An Order Flow trader can actually see exactly what is happening in the market as it happens. Once you are able to understand what is happening in the present, you are able to make far better decisions about what might happen in the future. Order Flow provides traders with vision into market activity. NF BNF
Market Profile Analysis dated 26th August
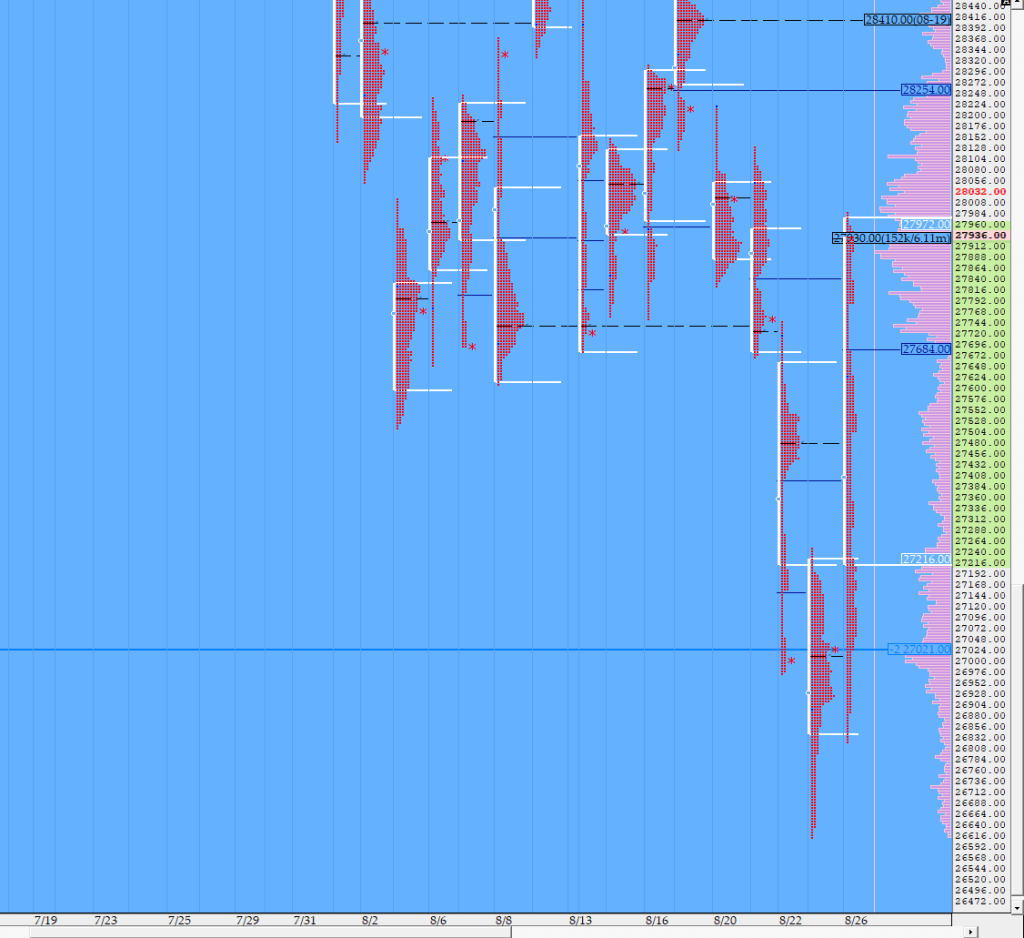
Nifty Aug F: 11054 [ 11072 / 10745 ] NF opened with a big gap up of over 100 points and probed higher as it tagged 10977 but was swiftly rejected as it closed the gap confirming an ORR (Open Rejection Reverse) start to the week and went on to fall by 233 points in the […]
Order Flow charts dated 26th Aug

When we think about how to measure volume in the market one of the keys is Order flow. It plays a role by telling us what the other traders have done in the market and are currently doing and this provides valuable clues and potential opportunities to trade. An Order Flow trader can actually see […]
Order Flow charts dated 26th Aug (5 mins)

Order Flow is one of the most effective methods to time your trades by seeing exactly what the other traders are trading in the market and positioning your bias accordingly. Order Flow is the most transparent way to trade and takes away the guesswork from decision making. NF BNF
Market Profile Analysis dated 23rd August
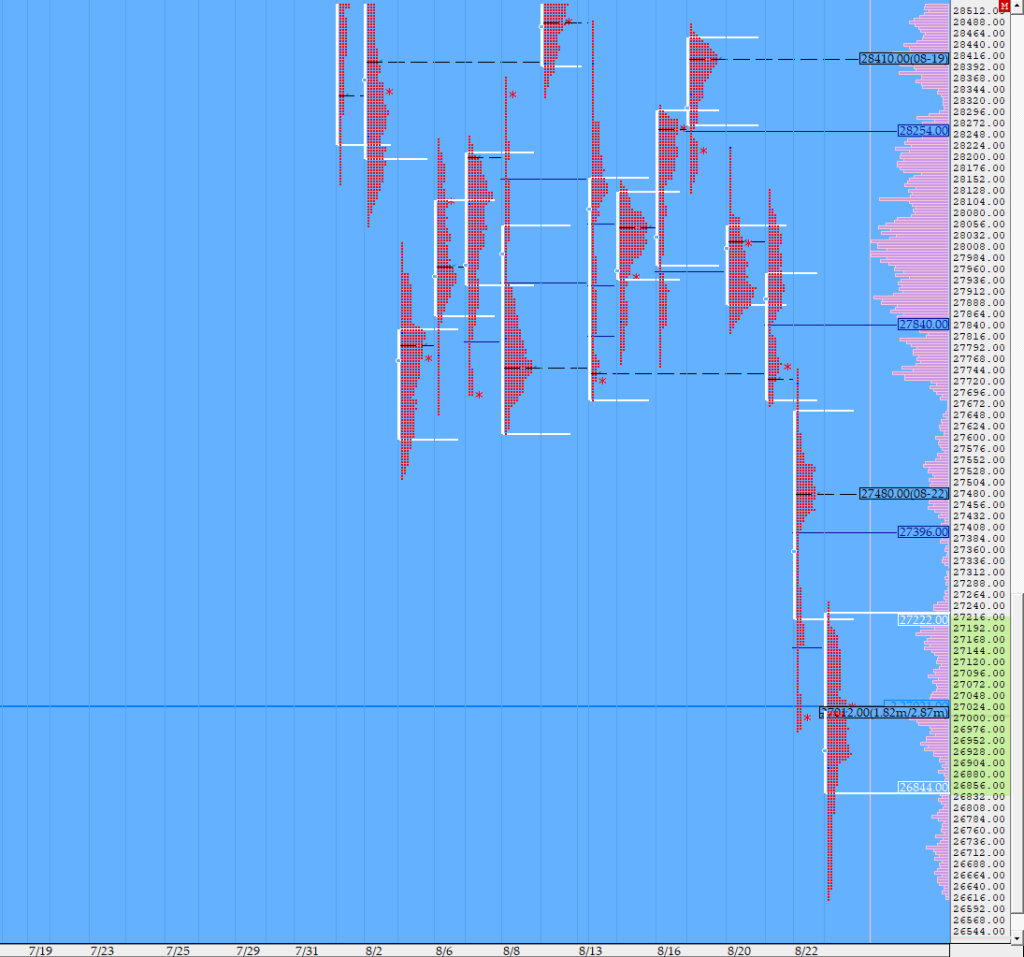
Nifty Aug F: 10843 [ 10880 / 10646 ] Detailed report to be updated… The NF Open was an Open Rejection Reverse – Down (ORR) which failed The day type was a Double Distribution Trend Day – Up Largest volume was traded at 10852 F Vwap of the session was at 10781 with volumes of 160.7 L and range […]
