Nifty Spot Weekly Profile (1st to 7th Feb 2020)
Spot Weekly 12098 [ 12160/ 11614 ]
Budget Day 11662 ( 12017 / 11633)
January 2020’s monthly report ended with this ‘The monthly profile is a well balanced one with the Value similar to that of previous month but the excess at top & close around the lows has set up the coming month for a big move to the downside where Nifty could make an attempt to enter the Value of October and tag the monthly VPOCs of 11290 & 10960‘
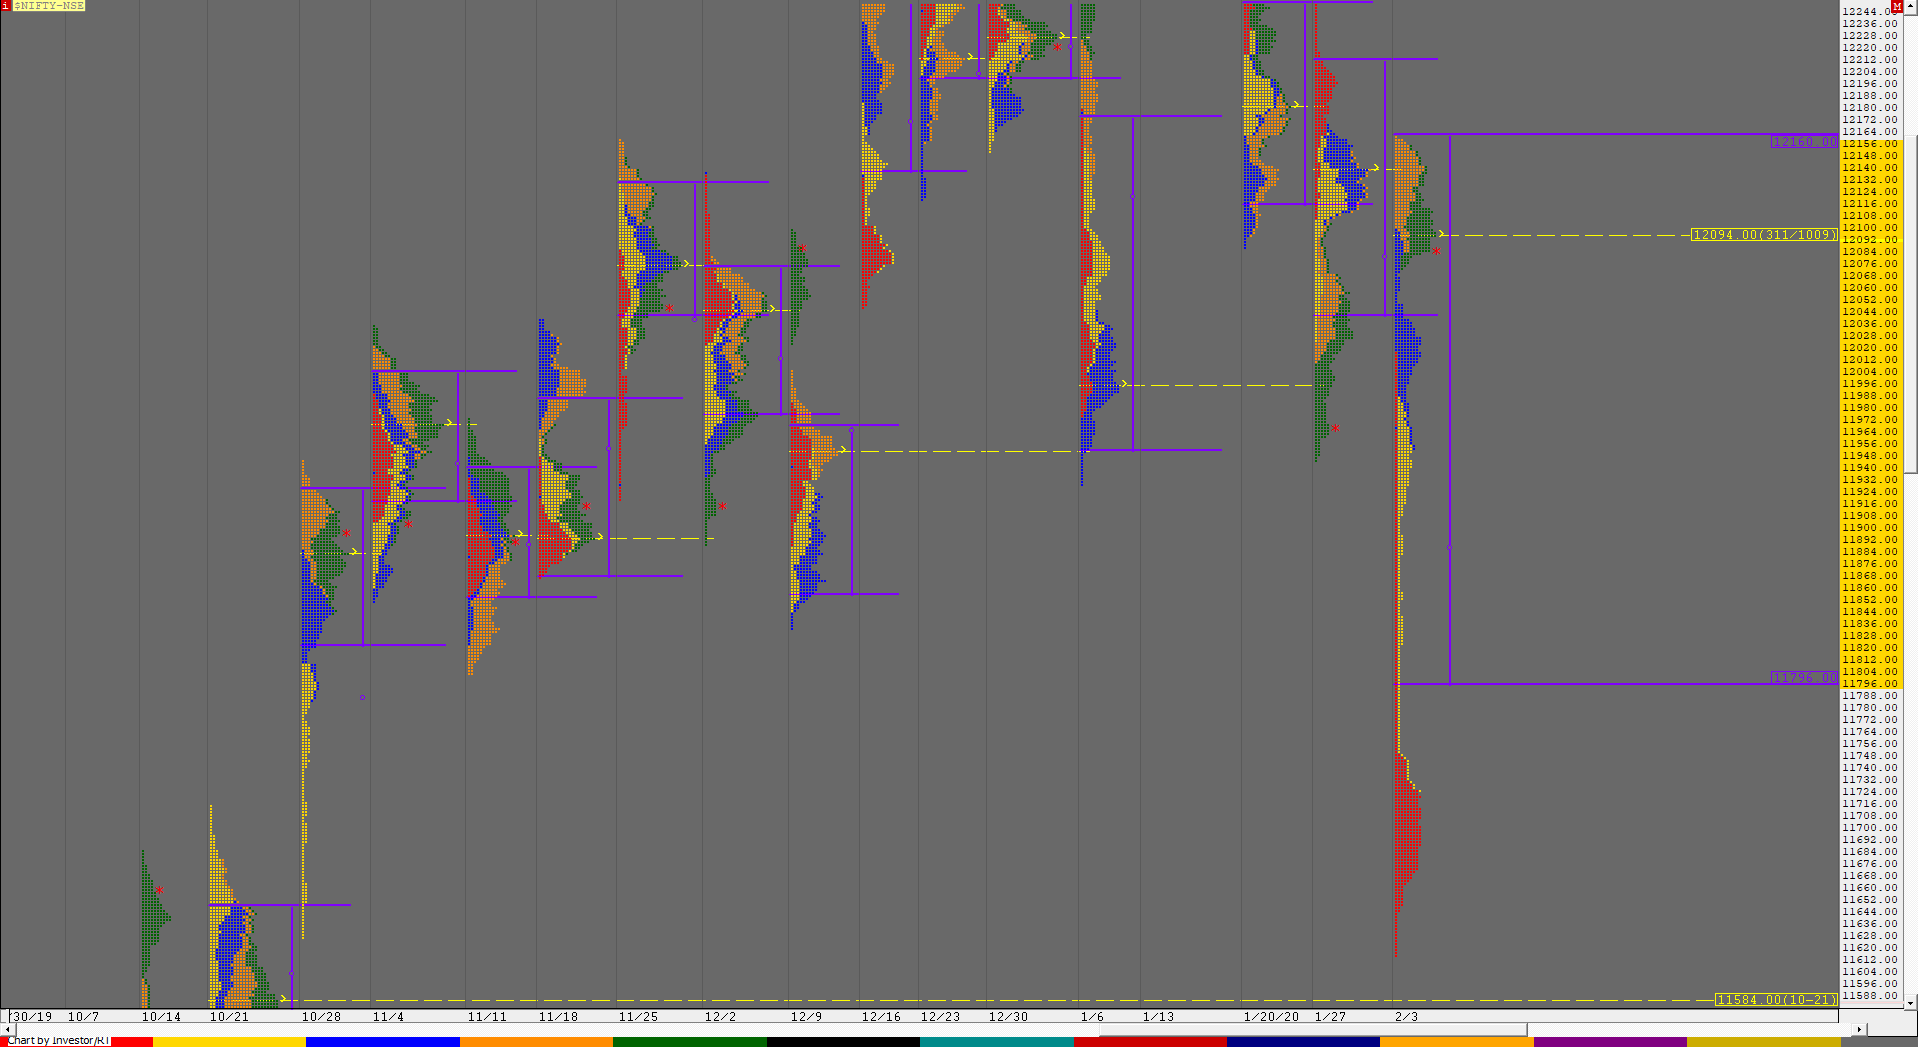
Nifty opened this month on a Saturday which was the Budget Day and the weak close of previous month led to a huge fall of 384 points on this day after Nifty confirmed a FA at 12017 which was just below the monthly VAL of 12020 and went on to complete the 2 ATR objective on the same day as it left a Trend Day Down while closing around the lows of 11633. Monday saw this imbalance to the downside continue at open as the auction made a lower start making new lows of 11614 but took support here right at the VAH of October 2019 (click here to view the monthly chart) which was the first sign that the IPM (Initial Price Movement) to the downside which began from the week starting 20th Jan from that OH of 12430 was coming to an end. Nifty left a small buying tail in the IB from 11645 to 11614 which added to the conviction after which it made a small balance & a ‘p’ shape profile for the day confirming that the downside was getting limited and followed up with a big gap up along with a drive higher on Tuesday as it left singles from 11822 to 11708 to make multiple REs (Range Extension) leaving 2 extension handles at 11857 & 11896 to leave a Trend Day Up. The auction then tested the Trend Day POC of 11964 at open on Wednesday and for the third consecutive day left singles at lows from 11980 to 11954 in the IB after which it formed a nice balance for most part of the day negating that FA of 12017 & getting accepted near previous week’s VAL of 12040 and once this balance was complete, Nifty gave yet another extension handle of 12049 as it made a fresh probe to the upside to close in a spike from 12049 to 12098 and this move continued on Thursday morning in the form of a gap up as it opened at 12120 & made highs of 12151 in the IB but for the first time in the week made a RE to the downside as it closed the gap and tested the spike zone where it took support after which went on to reverse the probe to the upside & made a RE making new highs for the week at 12160 stalling right at previous month’s POC leaving poor highs which suggested that the upmove was now getting exhausted and the imbalance to the upside could now lead to a balance being formed. This view got more weightage on Friday as the auction stayed in almost the same range as previous day once again unable to get past that monthly POC of 12160 and for the first time in the week left a selling tail in the IB from 12155 to 12138 to form a ‘b’ shape profile for the day with lower Value suggesting long liquidation happening in the final day of the week and which could further lead to a test of the extension handle of 12049 & below it a test of the VPOC of 12021.
The weekly profile is an elongated trending one with Value at 11796-12094-12160 which had a huge range of 546 points so the coming week could be a balanced one with a smaller range.
Click here to view the MPLite chart of this week’s auction in Nifty
Weekly Hypos for Nifty (Spot):
A) Nifty needs to sustain above 12103 for a move to 12142-160 / 12194 & 12230
B) Immediate support is in the zone of 12094-074 below which the auction could test 12049-021 / 11990-979 & 11964
C) Above 12230, Nifty can probe higher to 12266 / 12295 & 12322-331
D) Below 11964, lower levels of 11936 / 11896-881 & 11857 could come into play
E) If 12331 is taken out, Nifty can have a fresh leg up to 12364-377 & 12400-430
F) Break of 11857 could bring lower levels of 11827-822 & 11796-773
NF (Weekly Profile)
12098 [ 12167 / 11598 ]
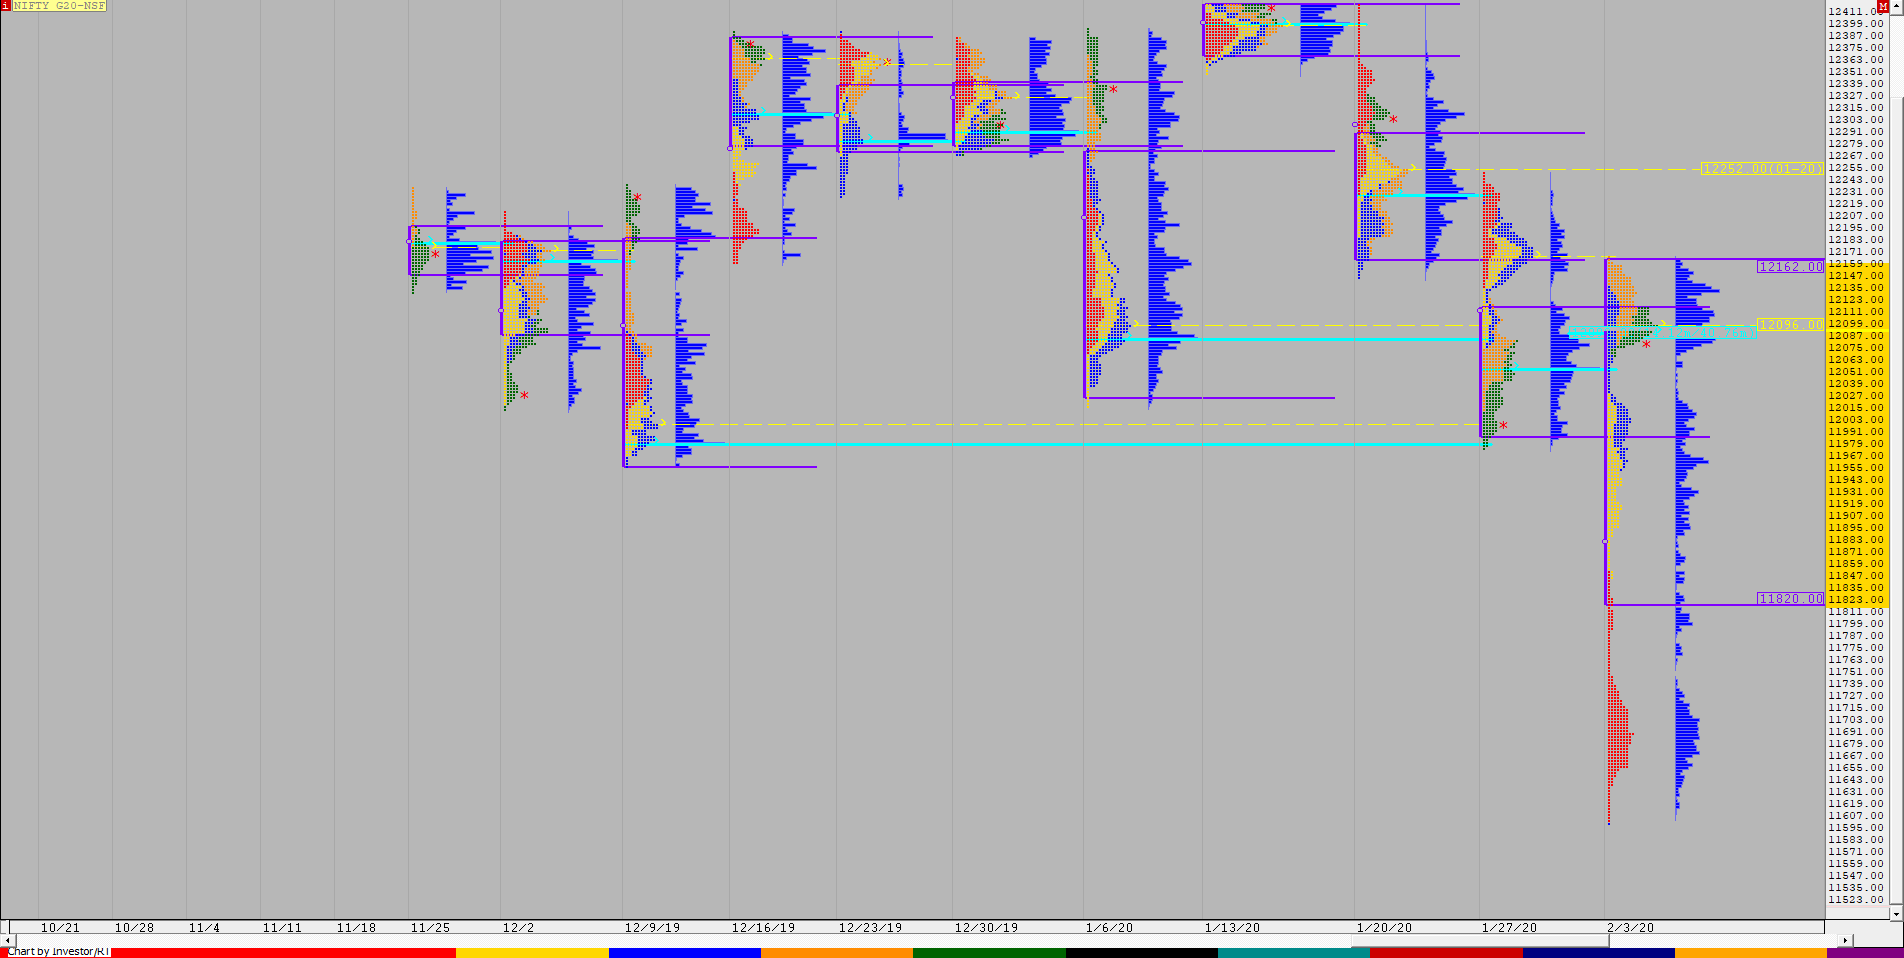
NF has made what looks like a Triple Distribution Trend Up weekly profile with Value at 11820-12096-12162 with a close at the POC in the top most balance. NF has singles from 12068 to 12028 which separates the middle part of the weekly profile having a HVN at 11955 below which we have another zone of singles from 11889 to 11747 below which we have the lowest distribution of the week with the HVN at 11688.
BankNifty Spot Weekly Profile (1st to 7th Feb 2020)
Spot Weekly 31202 [ 31470 / 29612 ]
Budget Day 29821 ( 30918 / 29753)
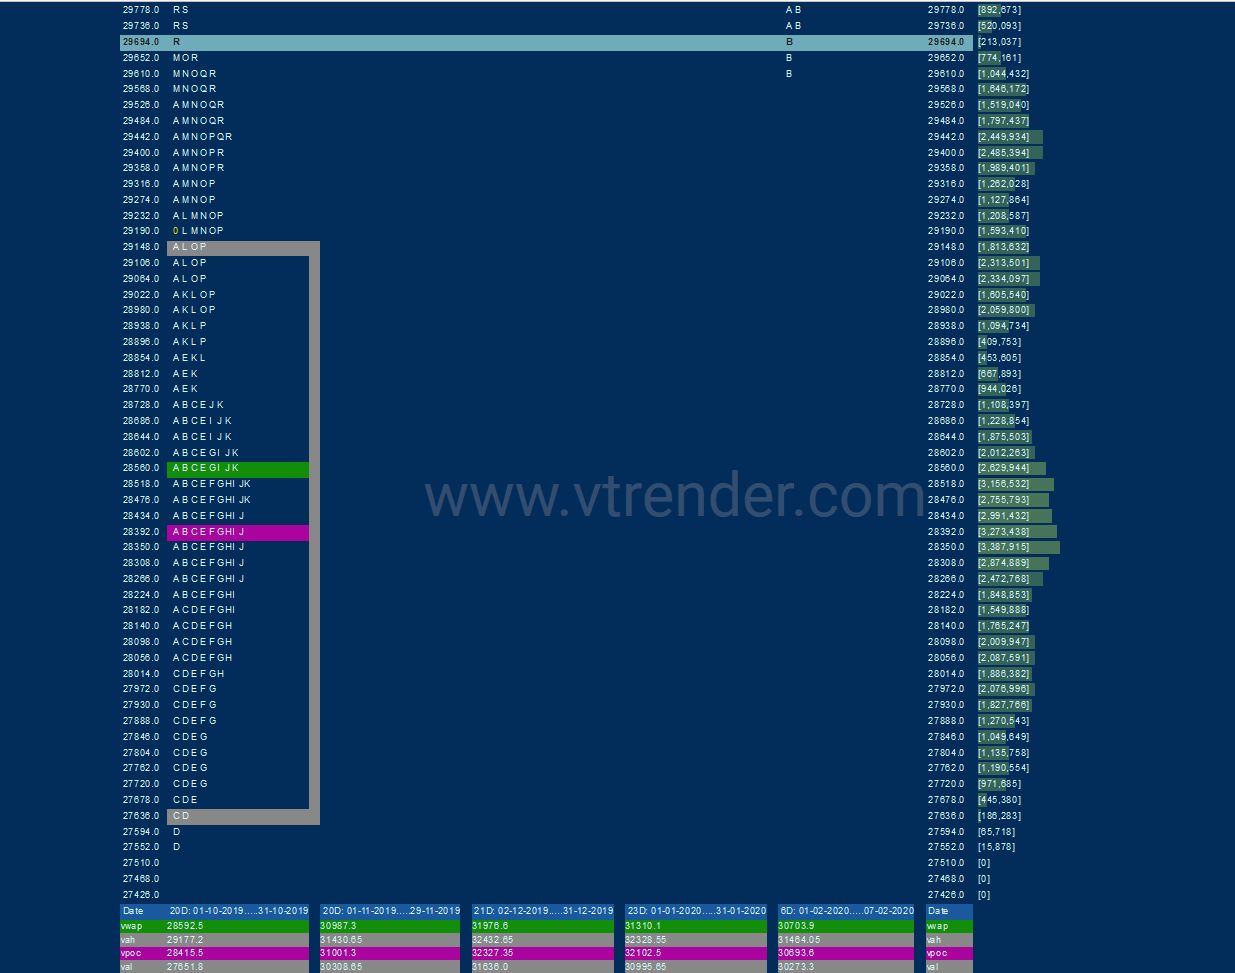
January 2020’s monthly report ended with this ‘The monthly Value was mostly lower & expanding to 30660-30900-31860 and acceptance below 30660 could lead to a test of October monthly spike low of 29693 below which we have that month’s VAH of 29220 and the monthly VPOCs of 28540 & 27160 as probable targets in the month(s) to come.’
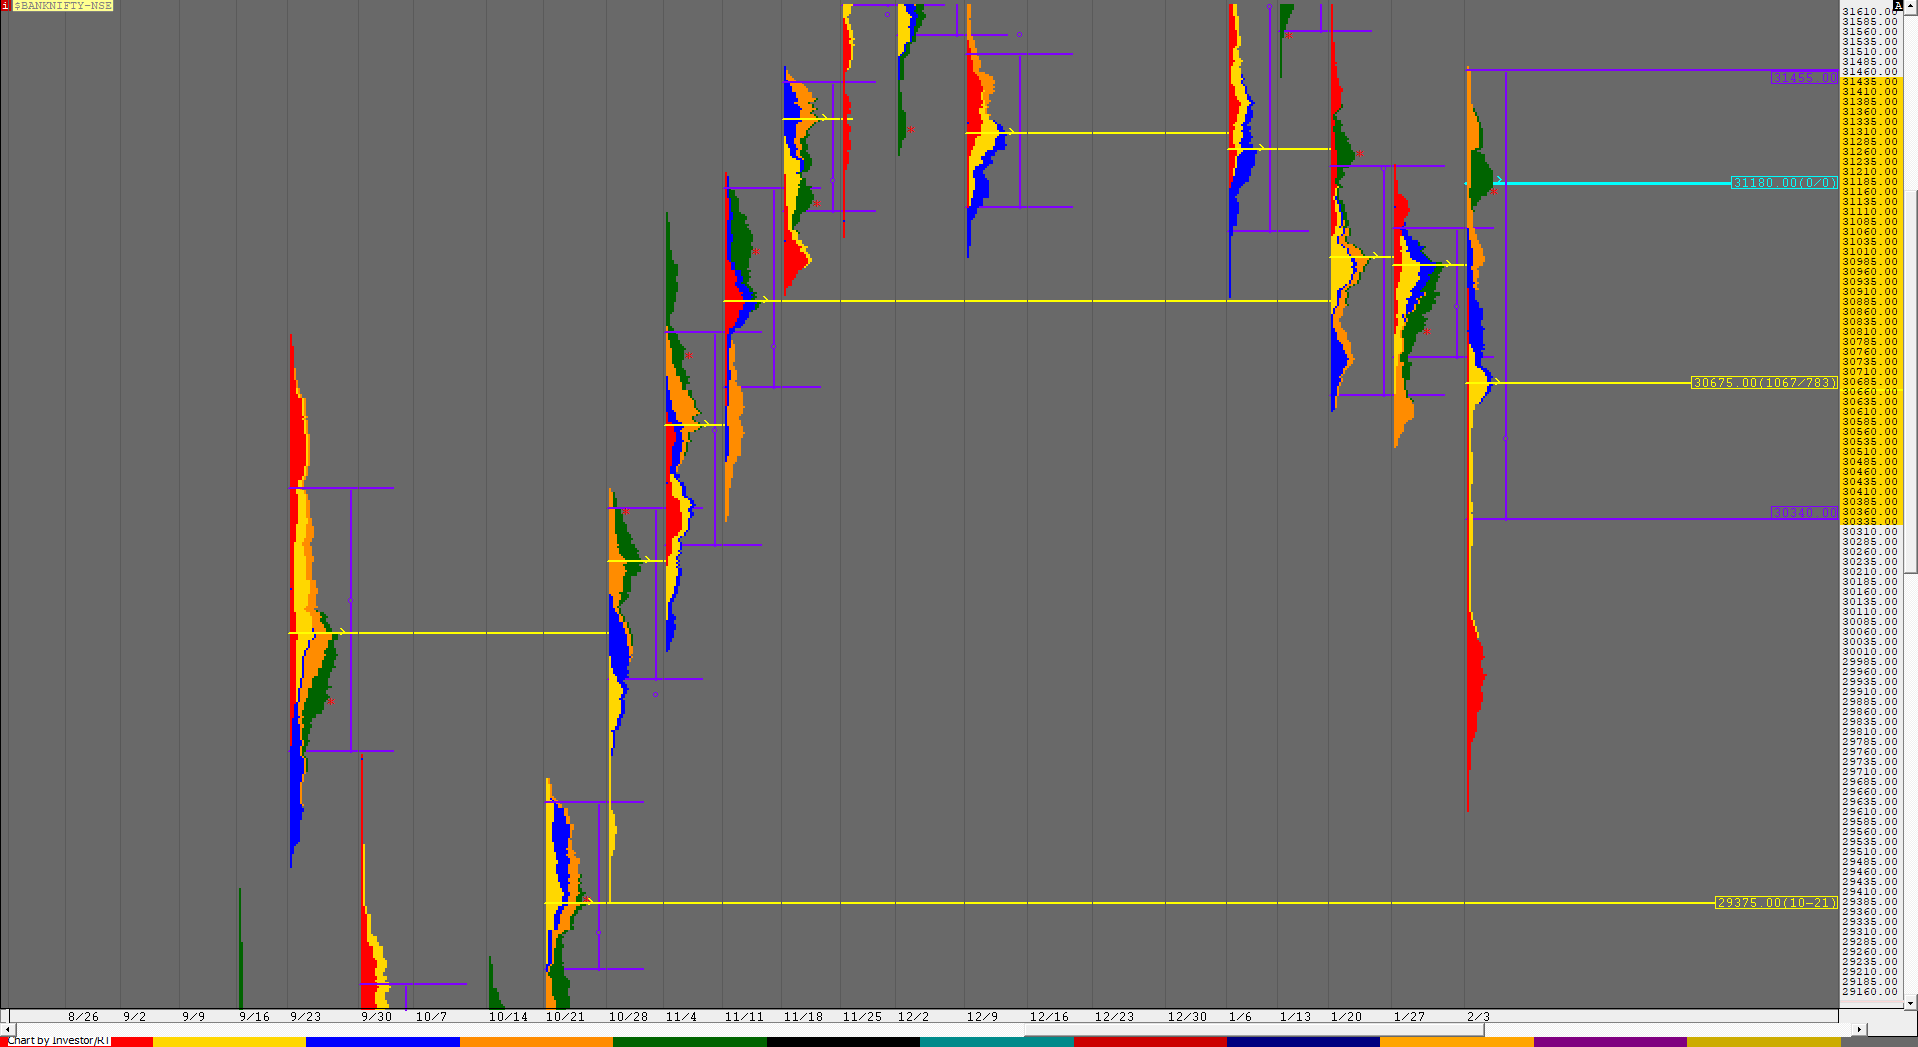
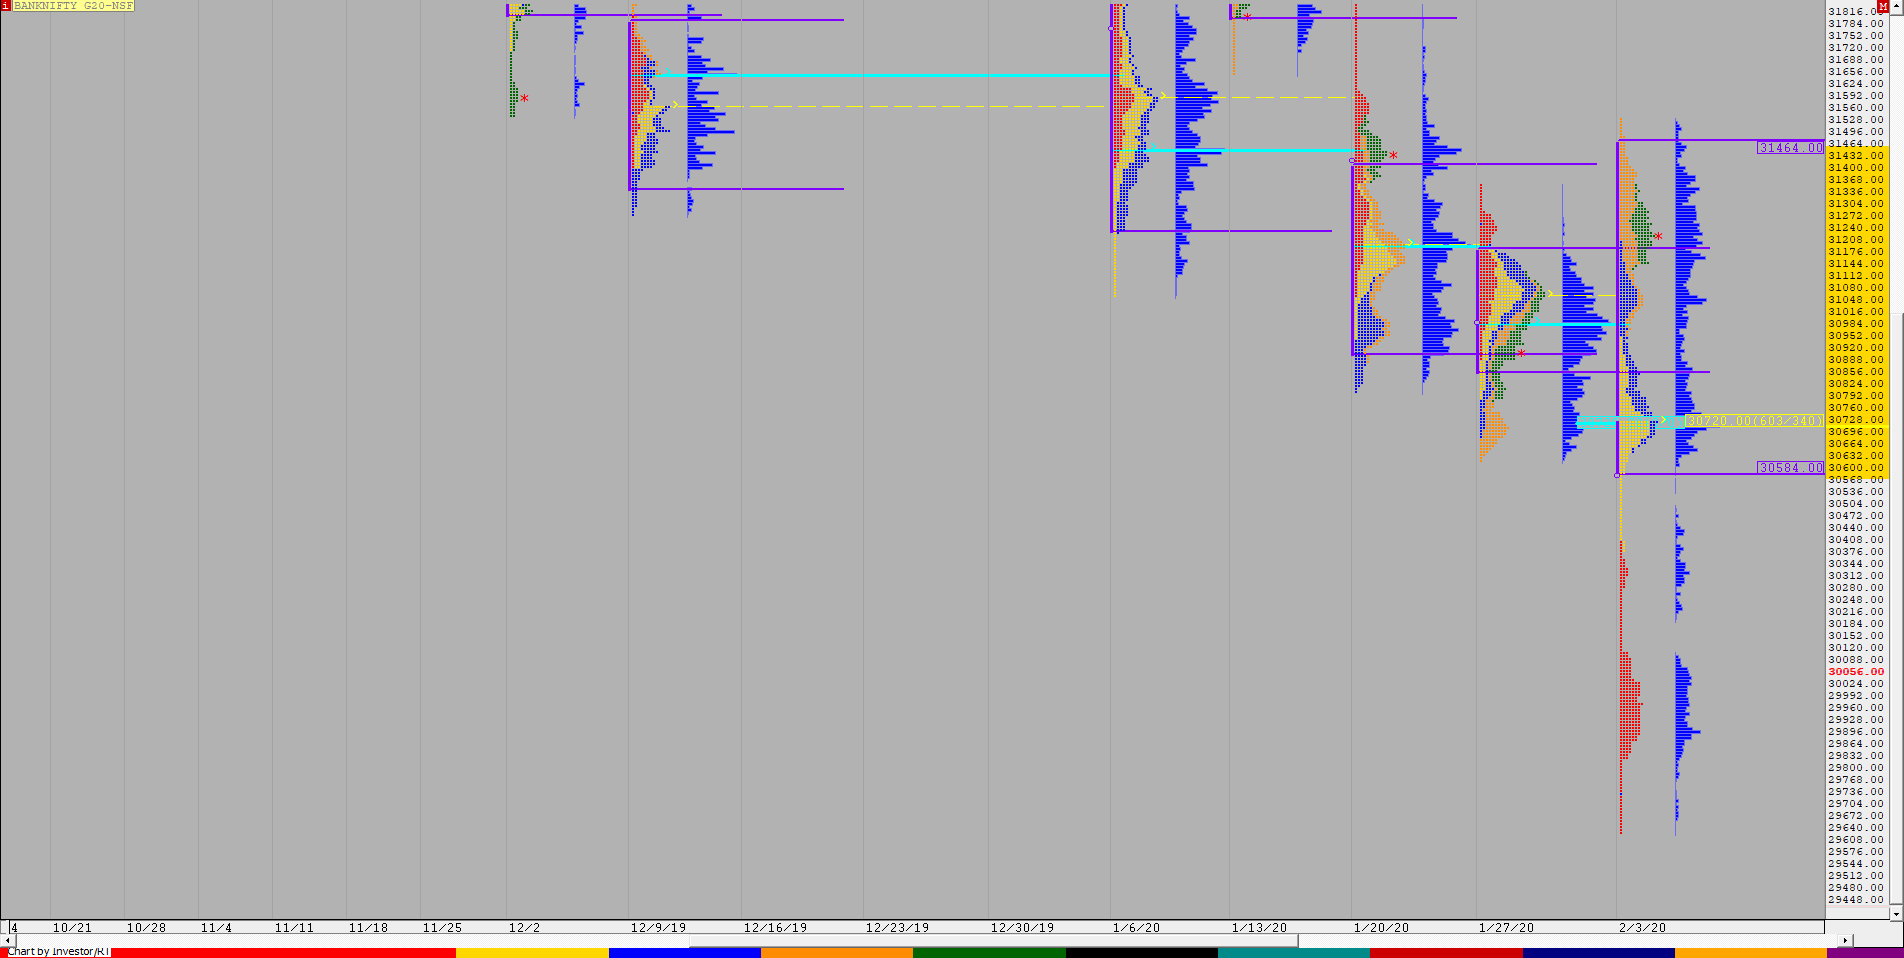
BankNifty also opened this month with a Trend Day Down on 1st Feb as it moved away from January’s monthly POC of 30900 as well as previous week’s Value after confirming a FA at 30918 in the first half of the day as it fell by more than 1100 points to close at 29821 after making lows of 29753. The auction continued to probe lower at open on Monday as it tested that monthly spike low of 29693 it had left in October and showed signs of demand coming back as it left a buying tail in the IB from 29715 to 29612 which was the first sign that the downside probe could be over. (click here to view the monthly chart) Monday ended as a nicely balanced ‘p’ shape profile with a close at the VAH and the next day opened with a big gap up of more than 200 points as BankNifty confirmed a buying tail from 30275 to 30023 in the IB which indicated initiative buying and went on to trend higher for the first half of the day making a high of 30777 as it stalled at the weekly VAL of 30755 and made a balance for the second part of the day forming yet another ‘p’ shape profile on the daily to close around the POC of 30694. The auction then formed a balance in the first half on Wednesday while leaving a PBL (Pull Back Low) at 30659 which was an important nuance as that was also the monthly VAH and this led to a trending move in the second half of the day as BankNifty as it negated the FA of 30918 and made new highs for the week while completing the 80% Rule in the weekly Value tagging the VAH of 31065 to the dot. Thursday saw the third consecutive gap up open as the auction made a high of 31143 in the ‘A’ period but for the first time in the week made a RE to the downside post IB though could not extend much leaving poor lows at 30917 which meant that the negated FA & the Budget Day high was now acting as support and this led to a nice trending move of over 550 points to the upside as BankNifty left an extension handle at 31143 and went on to scale above previous week’s high of 31227 and the recent swing high of 31375 to hit 31470 closing the day at 31304 leaving a Neutral Extreme profile with a big reference of 31143 to 31470 for the next session. Friday saw the auction returning to balance as it marked the narrowest range for the week of just 257 points while remaining mostly in the Neutral Extreme reference forming a ‘b’ shape profile indicating some profit booking by longs.
The weekly profile is an elongated one with multiple distributions spread over 1858 points with the Value also engulfing the previous 2 week’s Value at 30340-30675-31455 with a close around the HVN of 31180 which would the immediate reference for the next week.
Click here to view the BankNifty action this week with respect to the previous week’s Value on MPLite
Weekly Hypos for Bank Nifty (Spot):
A) BankNifty needs to sustain above 31241 for a move to 31330-380 / 31418-425 & 31505-531
B) Immediate support is in the zone of 31180-150 below which the auction could test 31065-050 / 30974 & 30918-900
C) Above 31531, BankNifty can probe higher to 31585 / 31660-690 & 31774
D) Below 30900, lower levels of 30770 / 30715-694 & 30630-595 could come into play
E) If 31774 is taken out, BankNifty could rise to 31860 / 31924-952 & 32041-056
F) Break of 30595 could trigger a move lower to 30535-505 / 30451-431 & 30381-364
G) Sustaining above 32056, the auction can tag higher levels of 32100-131 / 32196-221 & 32272
H) Staying below 30364, BankNifty can probe down to 30275 / 30190 & 30102-021
BNF (Weekly Profile)
31240 [ 31531 / 29631 ]
BNF has made a trending profile on the weekly with Value at 30584-30720-31464. Detailed report to be updated…

