Nifty Spot Weekly Profile (26th to 30th August)
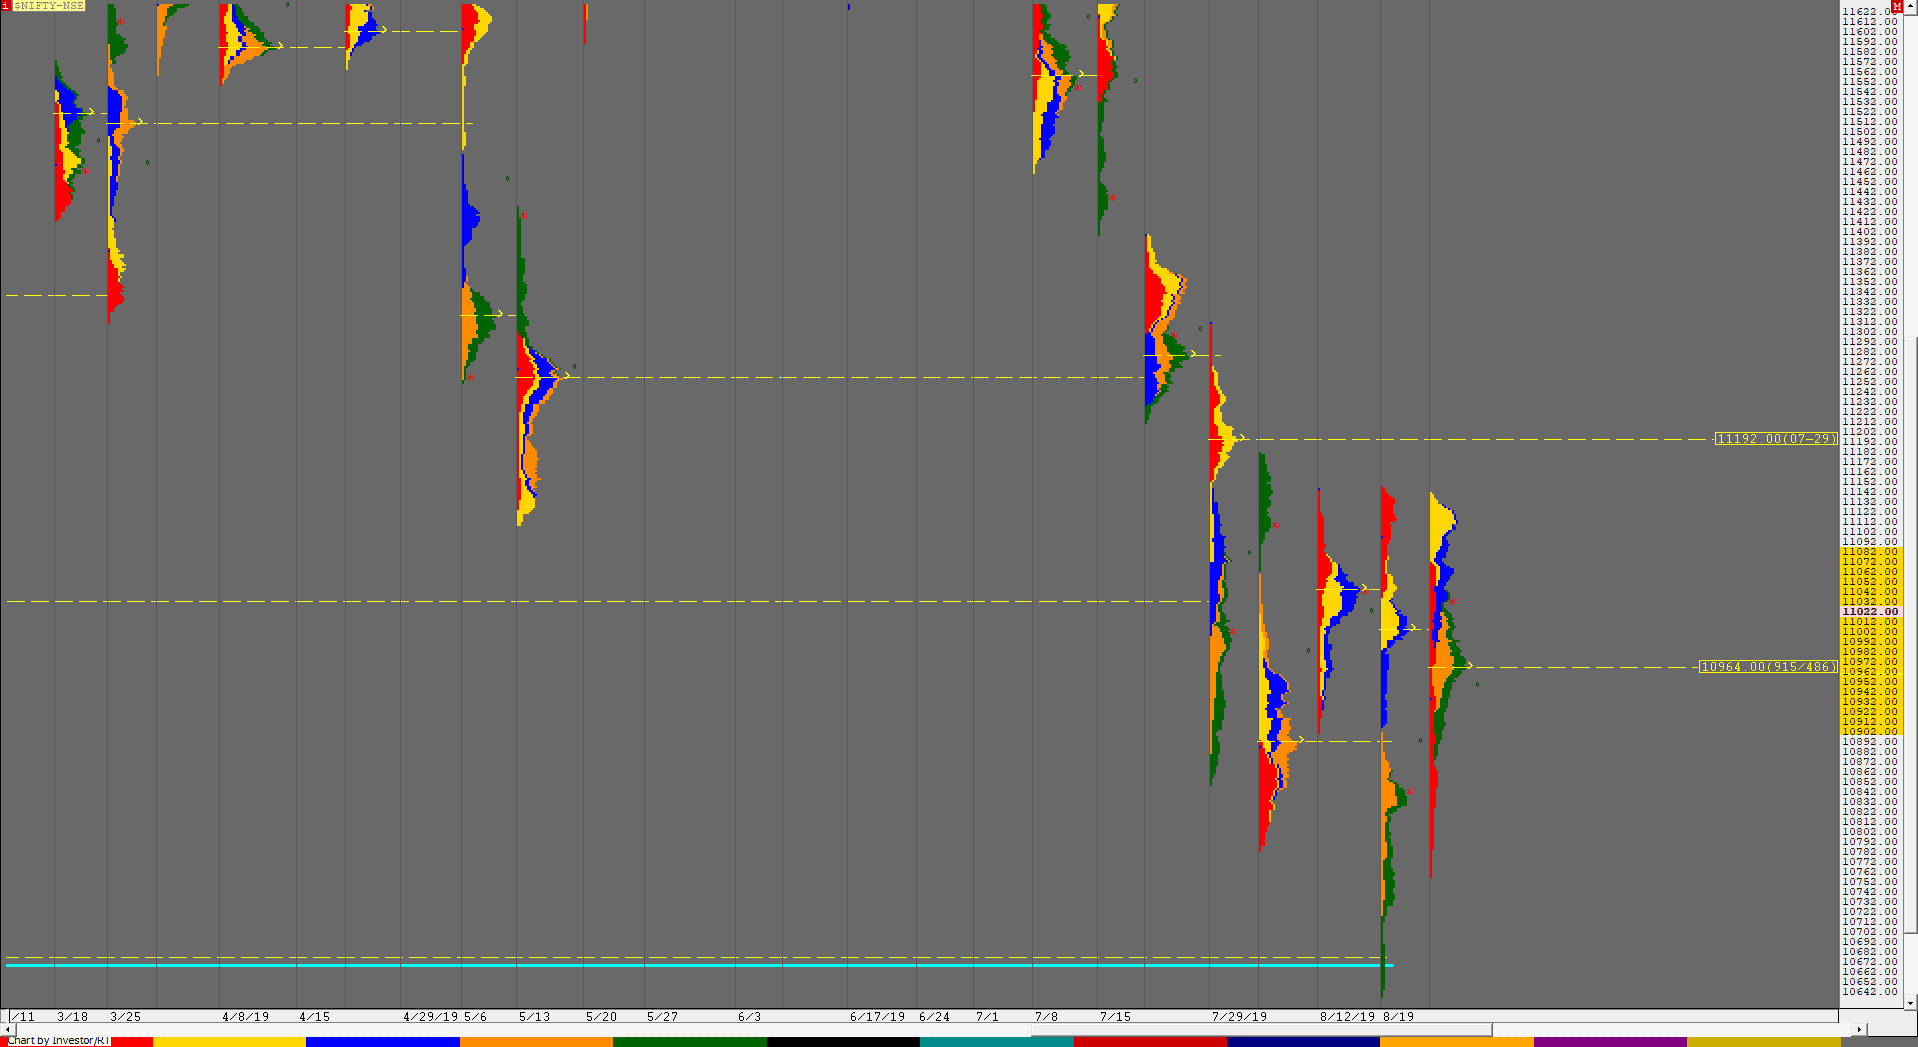
11023 [ 11142 / 10756 ]
Last week’s report ended with this line ‘Nifty has been forming a balance over the last 4 weeks (click here to view the composite) with the composite Value at 10832-11016-11144 so staying above 10832, the auction could remain in this balance in the coming week which would mark the end of the month‘
Nifty opened this week with a big gap up which was also an OH (Open=High) start at 11000 which was followed by a big liquidation move which saw the auction not just closing the gap but making a huge 244 point IB (Initial Balance) range on Monday as it made lows of 10756 where it got rejected as it left a small tail at lows from 10785 to 10756 to reverse the probe down with an equally fast paced auction to the upside as it went on to break above the OH start making new highs of 11070 and followed it up on Tuesday as it probed above the weekly VAH of 11075 and made similar highs of 11138, 11142 & 11135 which was the same zone where it had left poor highs in the previous week which suggested the probe to the upside was stalling. Nifty then trended lower over the next 2 days tagging a low of 10922 on Thursday where it made a swift rejection and went on to make new day highs for the day just before close. Friday open saw the auction testing the PDH (Previous Day High) of 11021 as it made highs of 11024 at open but was unable to sustain above it as it probed lower in the IB (Initial Balance) confirming a multi-day FA (Failed Auction) at 11024 with a 1 ATR objective of 10867 which was almost tagged as Nifty made a low of 10875 in the afternoon but went on to retrace the entire move down in the second half of the day as it negated the FA while making a high of 11042 to close the day with a Neutral profile while leaving an inside bar on the weekly though the Value which was at 10902-10964-11082 overlapped previous week’s Value on both sides. In fact, Nifty has been forming overlapping Value for the past 5 weeks & seems like is getting ready for a big move in the week(s) to come.
Weekly Hypos for Nifty (Spot):
A) Nifty needs to sustain above 11025 for a move to 11064-84 & 11119-131
B) Staying below 11020, the auction could test 10984 / 10964-959 & 10932-921
C) Above 11131, Nifty can probe higher to 11150-160 / 11184-192 & 11237
D) Below 10921, lower levels of 10900 / 10878-856 & 10816 could come into play
E) If 11237 is taken out & sustained, Nifty can have a fresh leg up to 11267-290 & 11310-320
F) Break of 10816 could bring lower levels of 10785-765 & 10728-713
G) Sustaining above 11320, the auction can tag 11343-355 & 11399-419
H) Break below 10713, Nifty could fall to 10661 & 10637-610
NF (Weekly Profile)
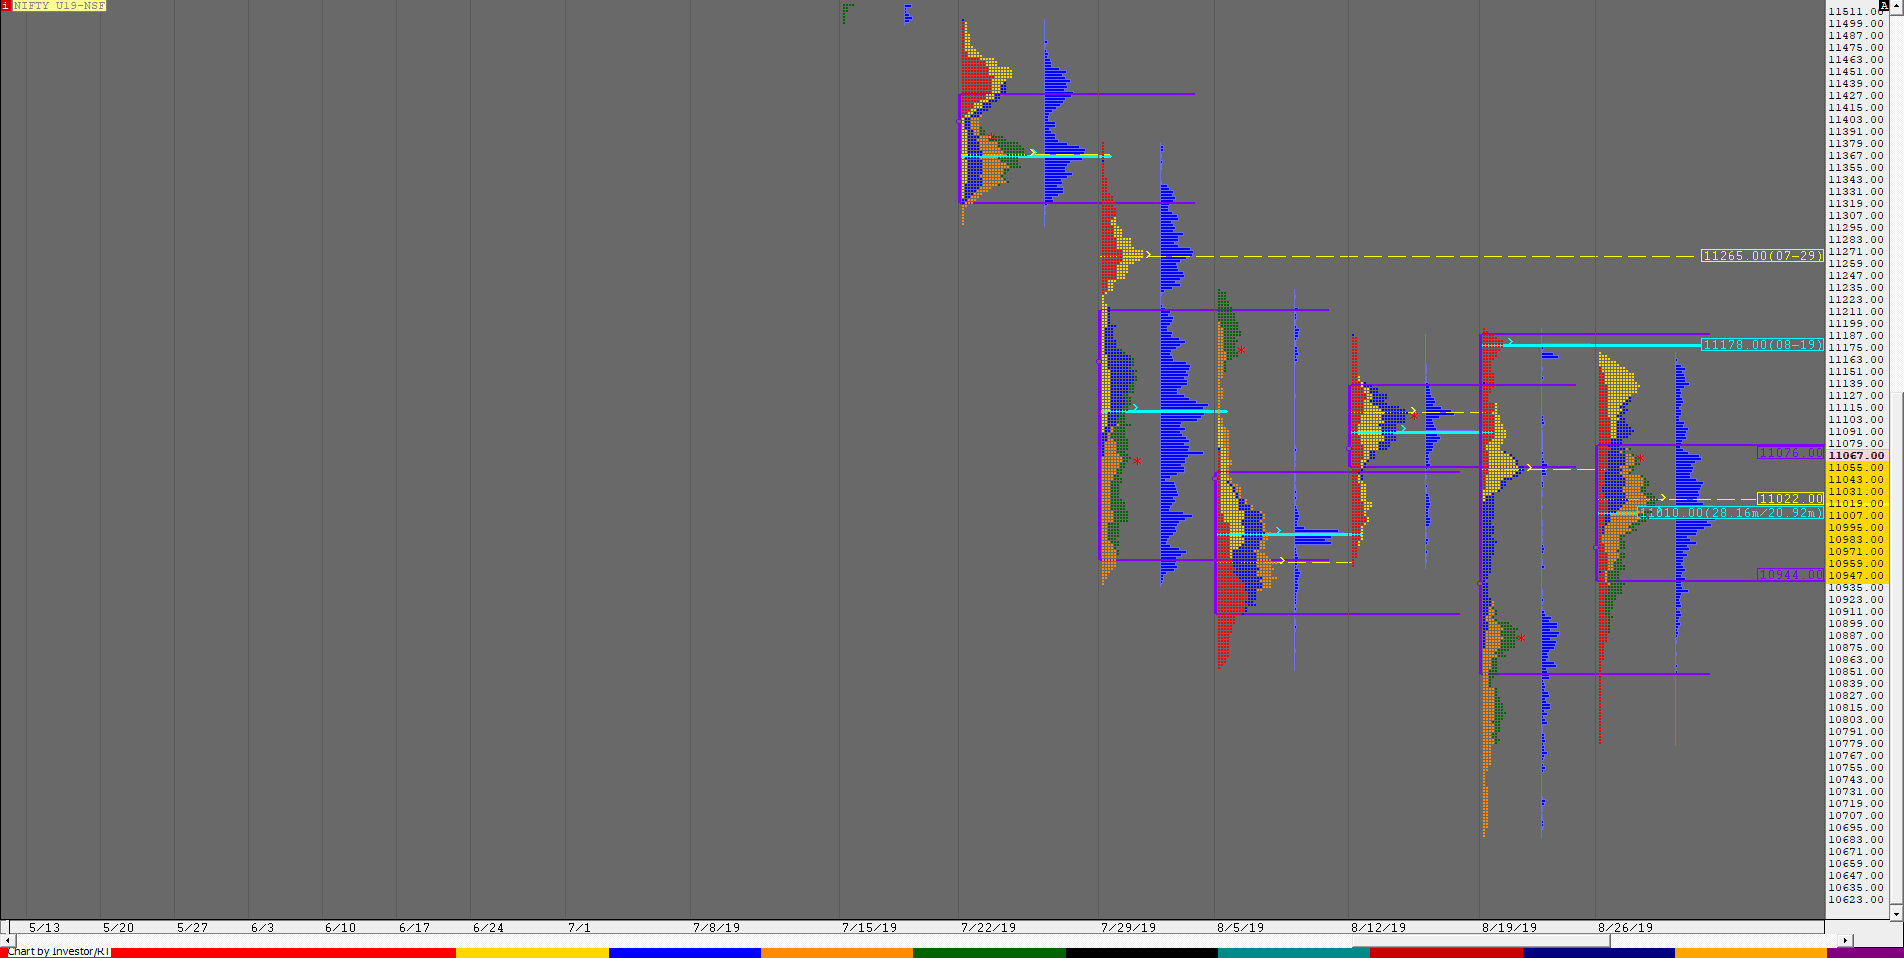
11059 [11171 / 10782]
After the previous week’s elongated profile, NF made an inside bar on the weekly time frame in terms of both range as well as Value after it left a buying tail on Monday from 10861 to 10782 and probed higher making highs of 11171 on Tuesday facing resistance at previous week’s HVN of 11178 as it formed a balanced profile on daily before giving a probe down for the rest of the week and confirming a multi-day FA at 11079 on Friday as it tagged the 1 ATR move down of 10906 as it made a low of 10890 before it gave a sharp bounce on Friday afternoon retracing the entire move down as it made a high of 11077 almost tagging the FA. The weekly Value is at 10944-11022-11076 being confined to a narrow range of just 132 points with a prominent POC from where we can expect a move away in the coming week.
BankNifty Spot Weekly Profile (26th to 30th August)
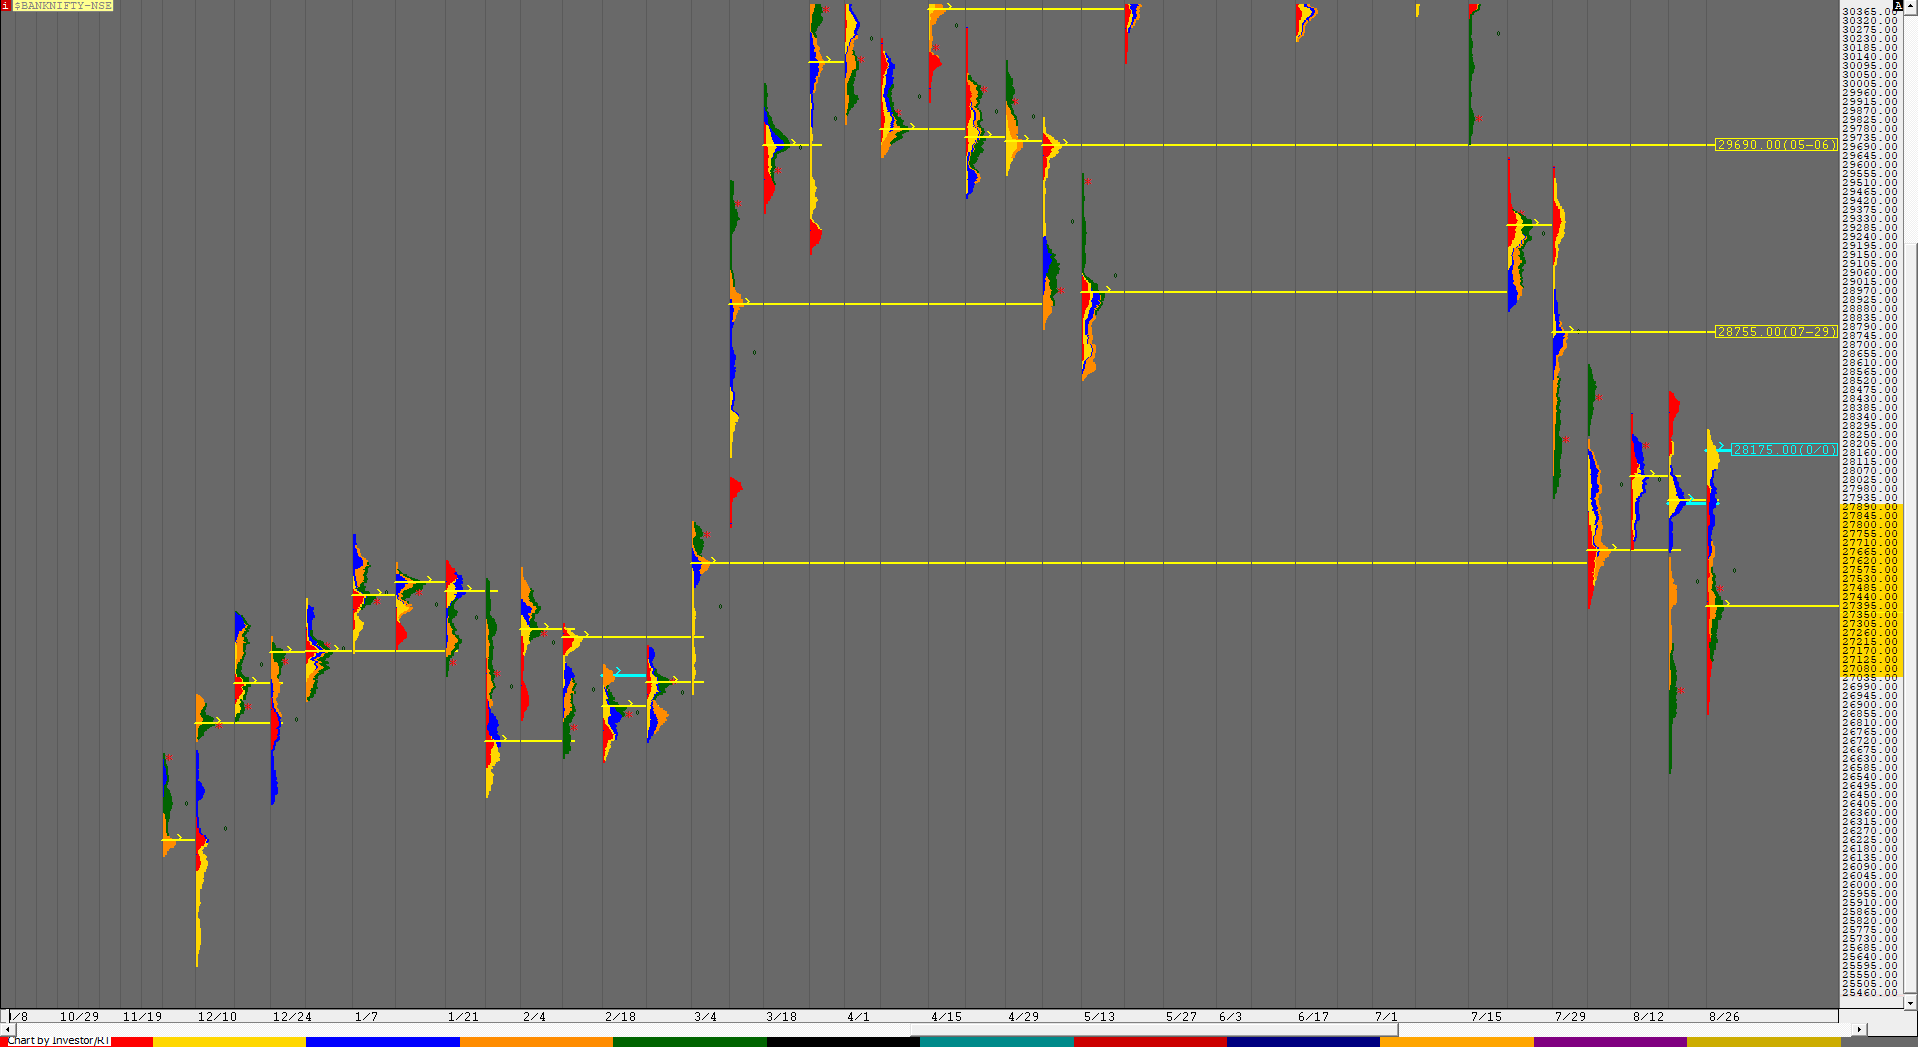
27428 [ 28278 / 26859 ]
BankNifty also opened with a big gap up of 700 points on Monday but like in Nifty, gave an almost OH start (Open=High) at 27664-27675 after which it made an even bigger move down closing the gap & leaving a 815 point IB (Initial Balance) range as it made lows of 26860. However, the auction could not extend the range lower as it left a small buying tail at lows from 26920 to 26860 which confirmed a reversal to the upside and followed it with a huge trending move higher as it not only retraced the entire fall but went on to make a successful RE (Range Extension) to the upside making new highs of 27995 and closed around the highs. BankNifty continued this imbalance on Tuesday as it opened with a gap up & probed higher in the IB making a high of 28274 and made an unsuccessful RE to the upside in the ‘C’ period as it made a marginal new high at 28278 but got back into the IB range making a balanced profile for the day indicating that the upside probe could be over. This view got further confirmation on Wednesday as BankNifty broke below PDL (Previous Day Low) confirming a multi-day FA at 27278 and made a successful RE to the downside which triggered a trending move lower as it tagged the 1 ATR objective of 27712 while making a low of 27635. The auction then got rejected at this 1 ATR level the next day as it made a high of 27719 at open on Thursday & continued the probe lower as it made a low of 27240 to once again give a weak close but opened with a gap up on Friday to catch some late shorts on the wrong side as it probed higher in the opening period to make a high of 27586 but reversed the entire up move in the next period following which it made a successful RE on the downside making multiple range extensions as it completed the 2 ATR objective of 27147 from the FA of 28278 as it made similar low of 27125 & 27122 in the ‘E’ & ‘F’ periods which confirmed the downside probe has been completed. BankNifty closed the week at 27428 leaving an inside bar on the weekly with overlapping Value for the 4th consecutive week leaving a nice composite on the bigger time frame (Click here to view the composite). This week’s Value is 27080-27395-27890 and the 4 week composite has the Value at 27395-27975-28225 with tails at both ends so a big move away from this balance can be expected in the coming week(s).
Weekly Hypos for Bank Nifty (Spot):
A) BankNifty needs to sustain above 27474 for a move to 27536-558 / 27640-655 & 27720-725
B) Immediate support is at 27402-390 below which the auction can test 27308-270 / 27225-200 & 27140-120
C) Above 27725, BankNifty can probe higher to 27804 / 27890 & 27960-975
D) Below 27120, lower levels of 27080-60 / 26975-970 & 26920-895 could come into play
E) If 27975 is taken out, BankNifty could rise to 28055-80 / 28141-175 & 28225
F) Break of 26895 could trigger a move lower to 26815 / 26740-733 & 26651
G) Sustaining above 28225, the auction can tag higher levels of 28278 / 28320 & 28391-407
H) Staying below 26651, BankNifty can probe down to 26570-545 / 26495-488 & 26441-407
BNF (Weekly Profile)
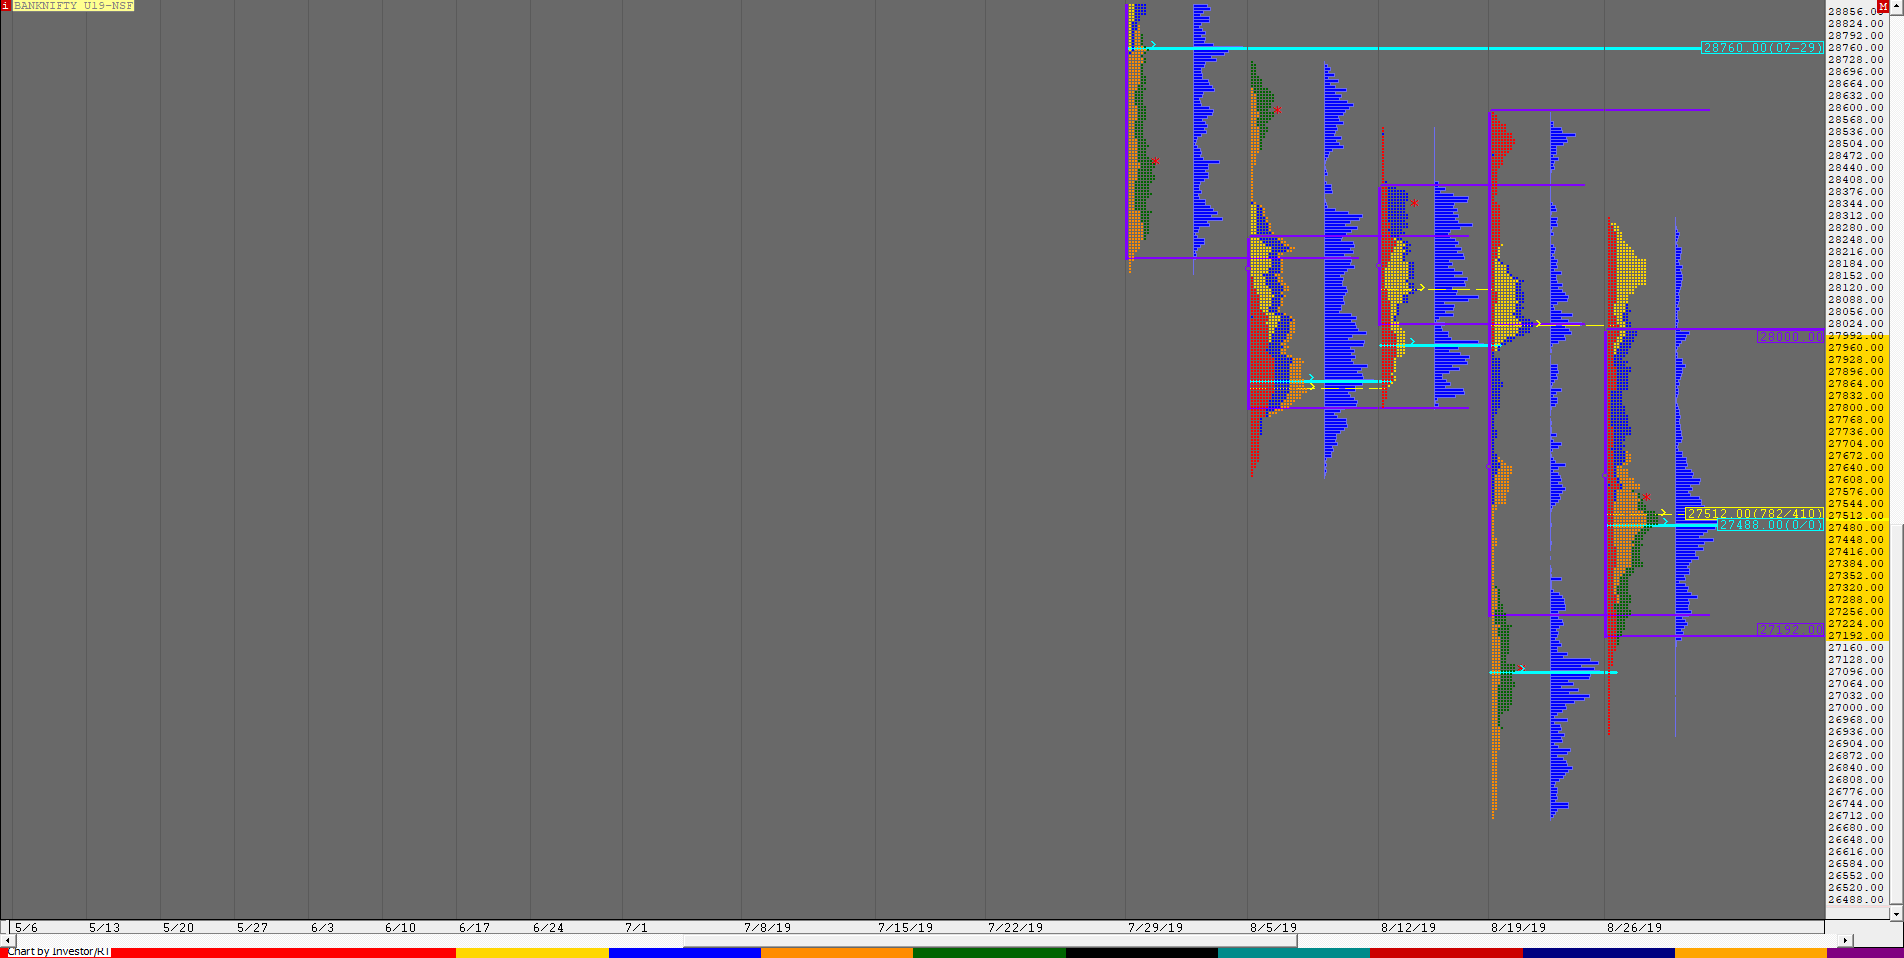
27016 [ 28485 / 26615 ]
BNF made yet another large range of 1402 points this week but remained inside previous week’s range with Value at 27192-27512-28000 also mostly inside previous week’s Value and has closed around the weekly POC of 27512 with a very good chance to move away in the coming week with 27096 reference on the downside. On the upside, BNF has the weekly HVN of 28760 which could come into play if the auction is able to probe above the weekly VAH & sustain


