Nifty Spot Weekly Profile (9th to 13th September)
Spot Weekly 11076 [ 11084 / 10889]
Last week’s report read ‘Nifty has formed a nice 3-1-3 profile on a 25 day composite starting from 31st July with Value at 10836-10974-11072 and an attempt this week to move away from this balance to the downside was rejected so can expect a probe higher in the coming week with 11014 & 11072-74 being the first objectives if the auction manages to stay above the HVZ (High Volume Zone) of 10964-10984‘
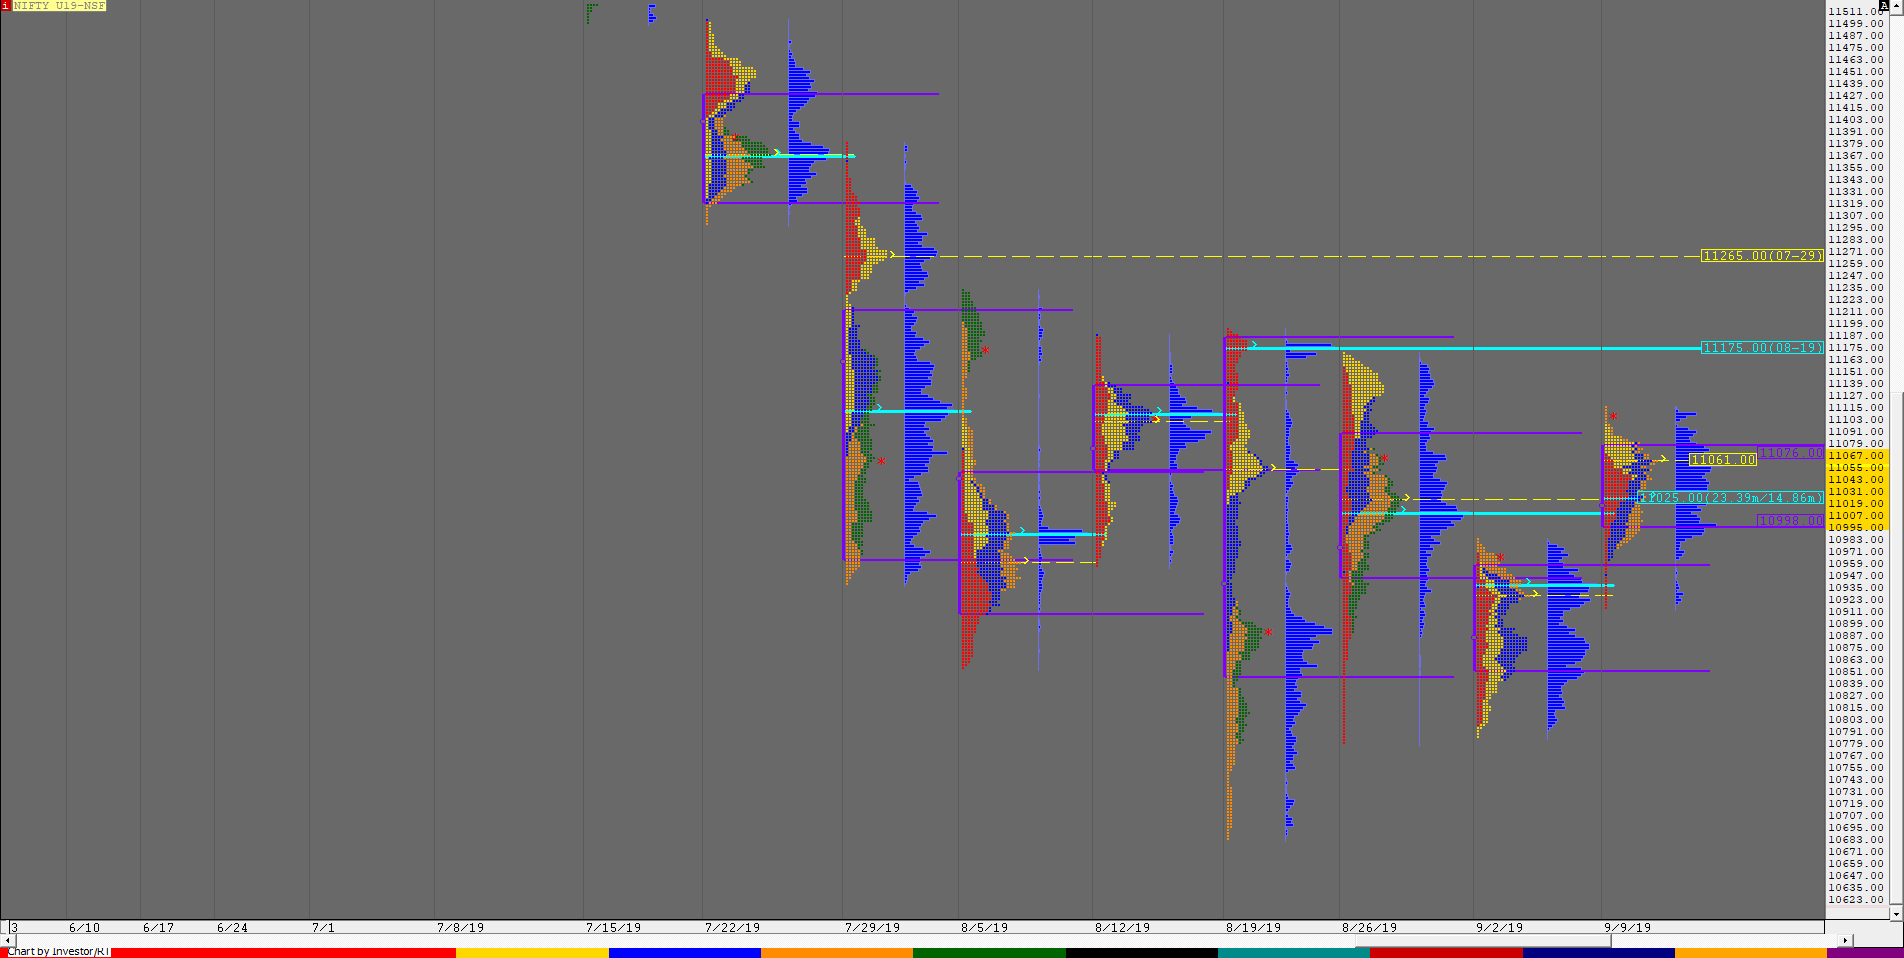
The auction played out the above expectation to the ‘T’ this week after a rather weak start as Nifty opened below the weekly VAL on Monday to initially probe lower but stopped short of the FA of 10867 as it made a low of 10889 which indicated that the downside was limited. Nifty then went on make a quick & big move higher leaving an early extension handle at 10937 in the IB (Initial Balance) as it scaled above PWH (Previous Week High) of 10967 and went on to tag the 1 ATR move of 11014 while making a high of 11029 on Monday afternoon after which it gave a retracement as the imbalance led to a balance giving a dip to 10965 as it left a pull back low (PBL) at the PWH to suggest that the upside probe is still not completed. The next day saw a higher opening after a holiday as Nifty made new highs for the week at 11055 but could not extend much leaving a narrow daily range of just 43 points which was the lowest range in more than 6 months and this meant poor trade facilitation at higher levels. The auction then gave another gap up open on Thursday and probed higher as it hit the weekly objective of 11078 inside the IB where it made highs of 11081 but the failure to extend the range to the upside led to a big liquidation move as Nifty left a Trend Day down testing that PBL of 10965 and continued this weakness on Friday open as it got back into previous week’s range making a low of 10946 but managed to stay above the weekly VAH and that extension handle of 10937 hinting that the downside probe could be over. The auction then formed a balance for most part of the day staying inside the IB range and as the downside probe seemed completed, the PLR (Path of Least Resistance) had changed to the up and the auction obliged by initiating an early spike via a late RE (Range Extension) as it made a 100 point rise in the last 2 hours and went on to make new highs for the week at 11084 before closing at 11076 leaving a ‘p’ shape weekly profile with higher Value at 10972-11036-11042.
Nifty continues to remain in the large composite it has been forming since 31st July & looks like is getting ready for a move away from here in the coming week as has closed at the VAH of the composite Value which is at 10848-11039-11079 with the PLR being to the upside as far as the POC of 11039 is held.
Click here to view the composite chart
Weekly Hypos for Nifty (Spot):
A) Nifty needs to sustain above 11078 for a move to 11108-131 & 11160-184
B) Immediate support zone is 11039-25 below which the auction could test 10995-972 & 10943-921
C) Above 11184, Nifty can probe higher to 11220-237 & 11276-290
D) Below 10921, lower levels of 10869-842 & 10816 could come into play
E) If 11290 is taken out & sustained, Nifty can have a fresh leg up to 11343-355 & 11396
F) Break of 10816 could bring lower levels of 10772-765 & 10746-713
NF (Weekly Profile)
11105 [11118 / 10915]
NF has made a ‘p’ profile with a spike on weekly with higher Value but once again the Value range contracted to just 78 points which means that the auction is waiting for some new business for a range expansion in the week(s) to come. Spike Rules will be in play for the coming week and the spike reference is 11118 to 11075 with important support levels at 11061 & 11025. The weekly Value is at 10998-11061-11076.
BankNifty Spot Weekly Profile (9th to 13th September)
28099 [ 28127 / 26993 ]
Last week’s report ended with this ‘The weekly Value was lower but the range was the lowest in 10 weeks indicating that trade facilitation is getting poorer to the downside and that BankNifty may probe higher to check for supply with the first reference being the weekly VPOC of 27385‘
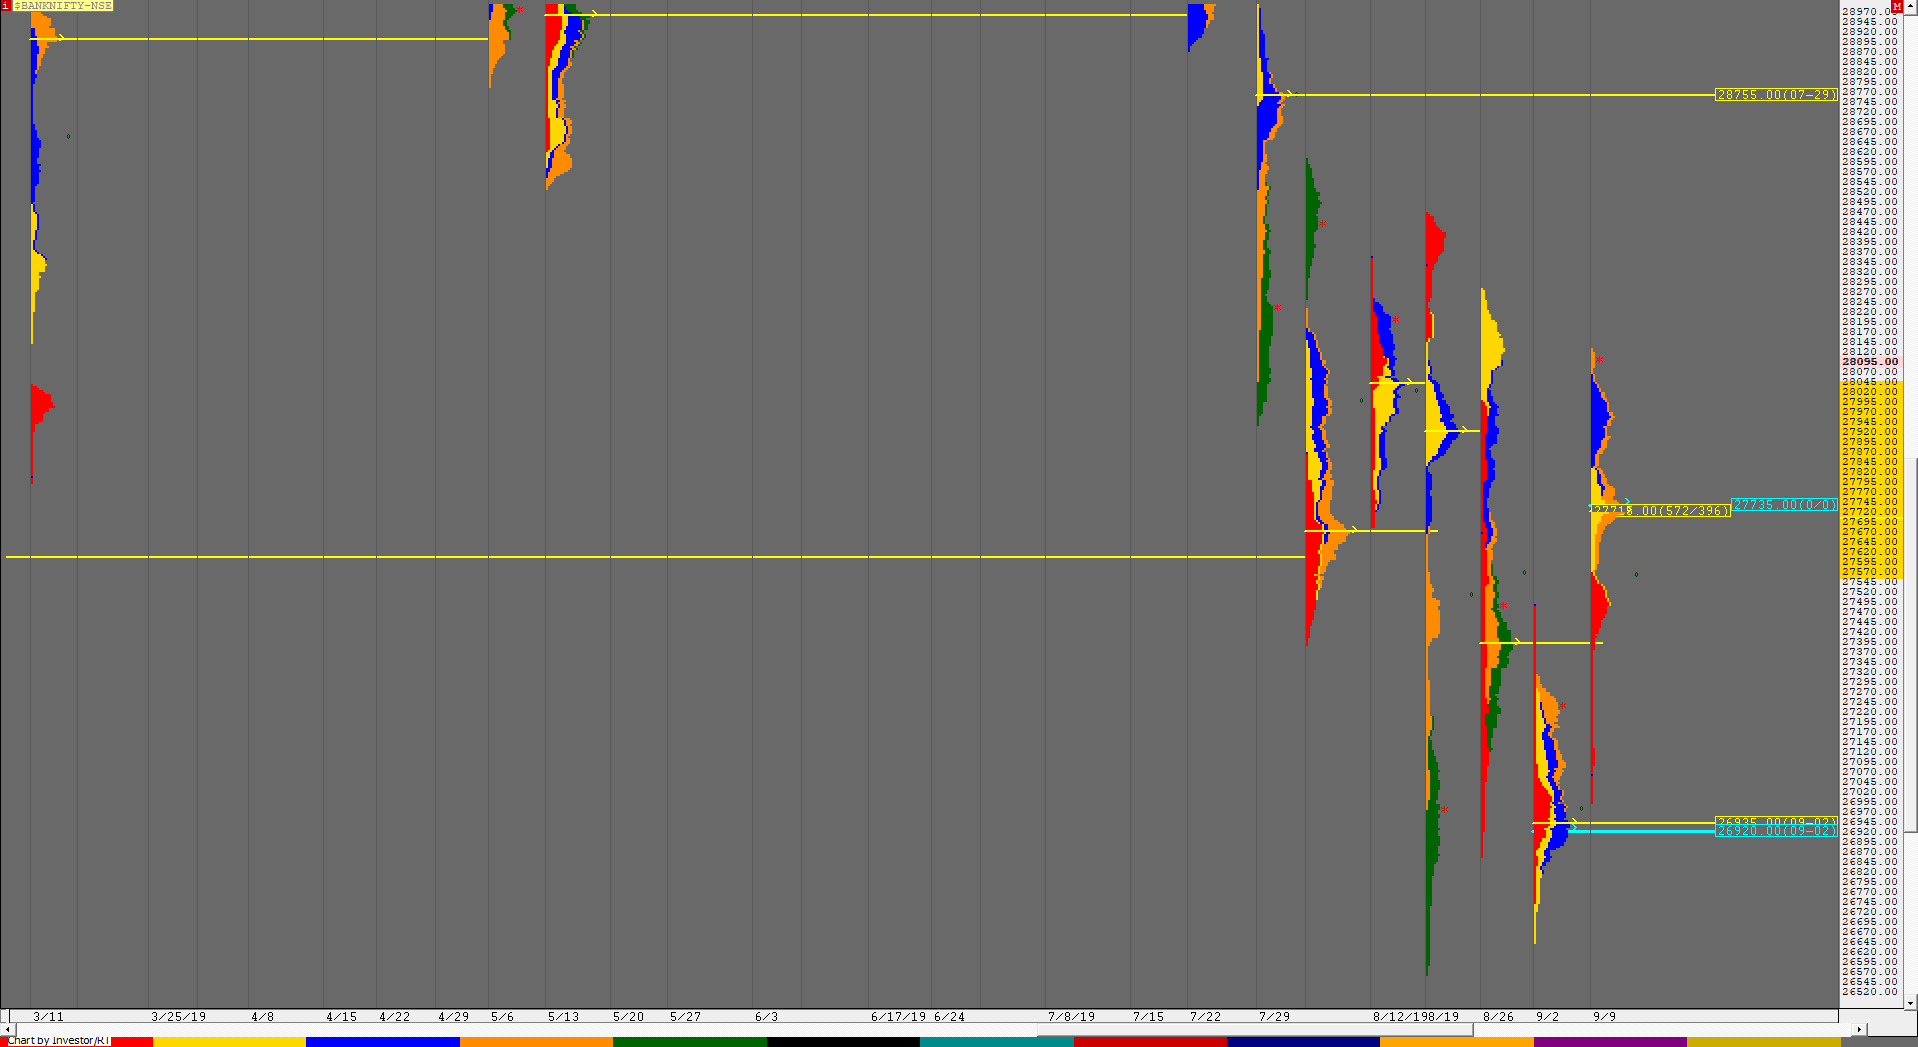
Similar to Nifty, BankNifty also made a weak open & started the week with a probe lower as it got into the previous week’s Value but was rejected swiftly from 26993 as it left a buying tail from 27085 to 26993 not tagging the previous week’s POC of 26935 which indicated demand coming in and then not just got back above the weekly VAH but also left an extension handle at 27240 which was a very bullish sign as the auction went on to scale above previous week’s highs and then took out that weekly VPOC of 27385 on the first day itself and went on to give a Triple Distribution Trend Up profile for the week where it made higher highs on all days and went on to close in a spike which indicates that the upside probe is still not completed. This week’s Value is 27570-27715-28045 and the auction looks set to take out the vPOC of 28141 and continue higher towards the next weekly VPOC of 28755 provided it stays above this week’s Value. On the downside, immediate support below 28045 is at 27960 below which the auction would turn weak.
Weekly Hypos for Bank Nifty (Spot):
A) BankNifty needs to sustain above 28141 for a move to 28225-278 / 28320 & 28391-407
B) Immediate support is at 28057-45 below which the auction can test 27973-960 / 27907-890 & 27803-795
C) Above 28407, BankNifty can probe higher to 28470-474 / 28561 & 28612-646
D) Below 27795, lower levels of 27735-715 / 27650-640 & 27590-557 could come into play
E) If 28646 is taken out, BankNifty could rise to 28710-755 / 28816 & 28876-901
F) Break of 27557 could trigger a move lower to 27505-474 / 27409-391 & 27311-308
BNF (Weekly Profile)
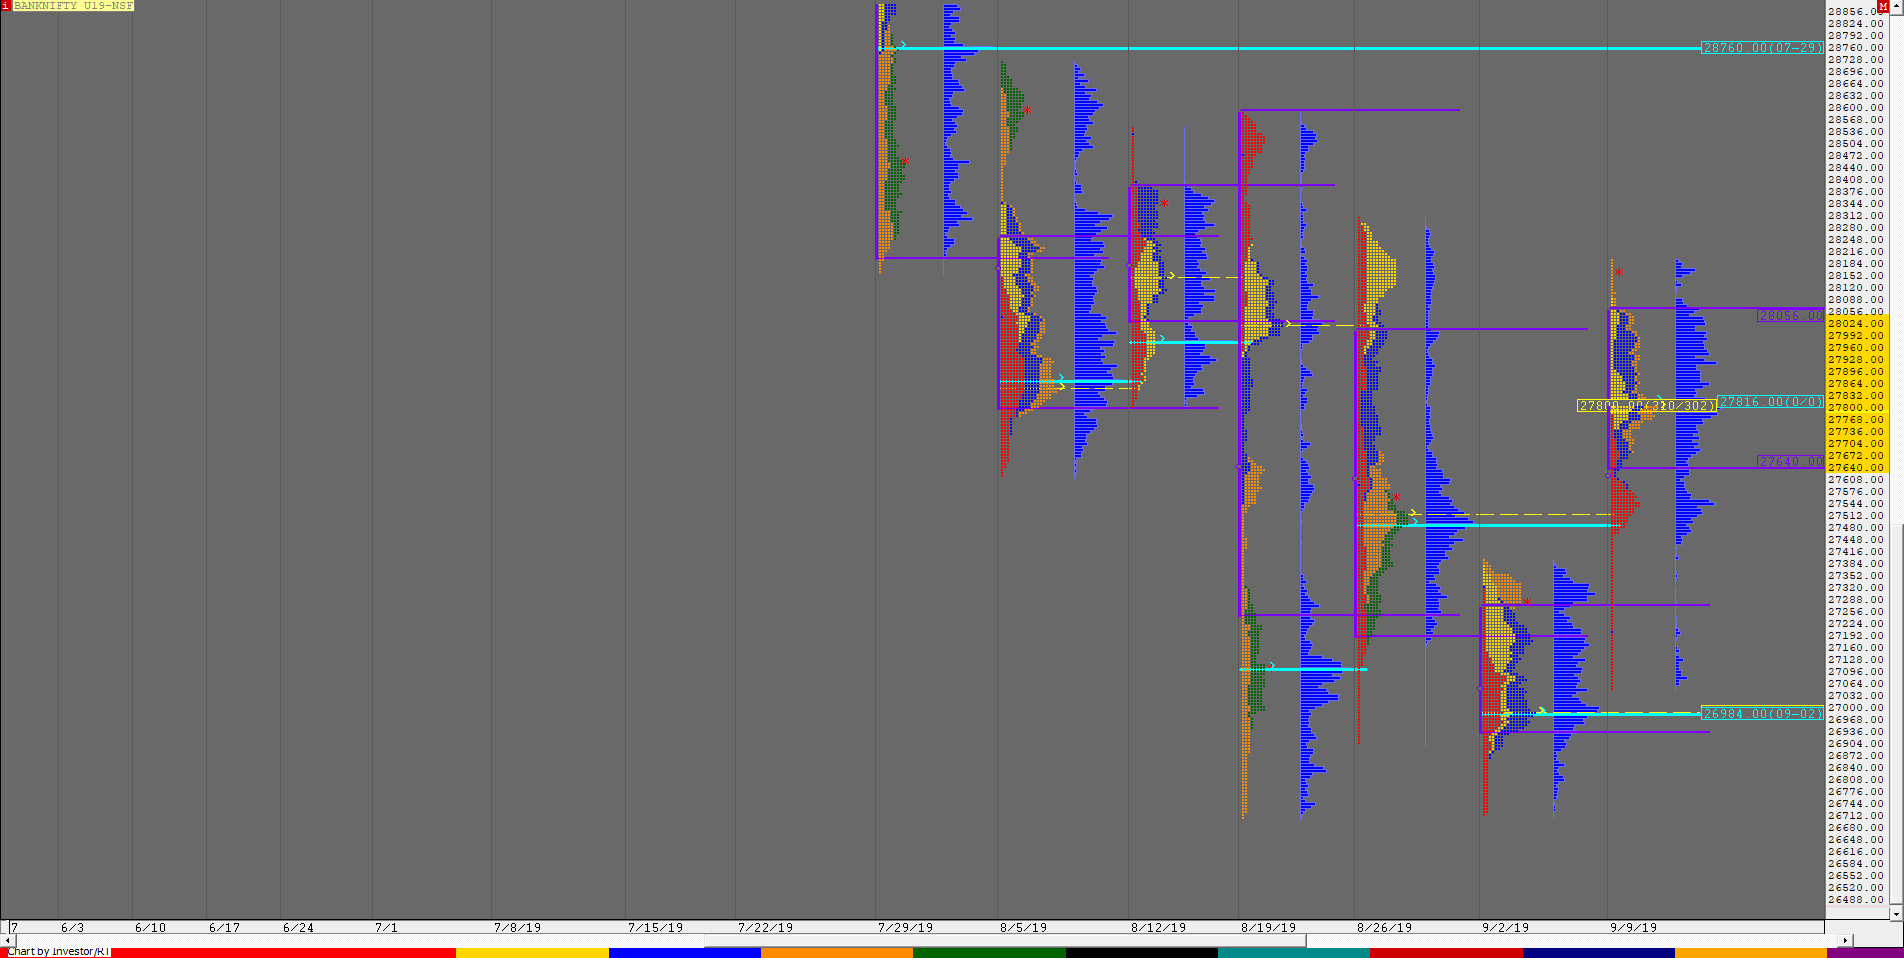
28164 [ 28200 / 27035 ]
BNF opened the week with a gap down and probed lower as it made a low of 27035 taking support just above PDL of 27025 after which it left an extension handle of 27268 & trended higher for the entire week leaving a ‘p’ shape weekly profile & closing in a spike. The weekly Value was completely higher at 27640-27800-28056 and the spike reference for the coming week is 28095 to 28200.


