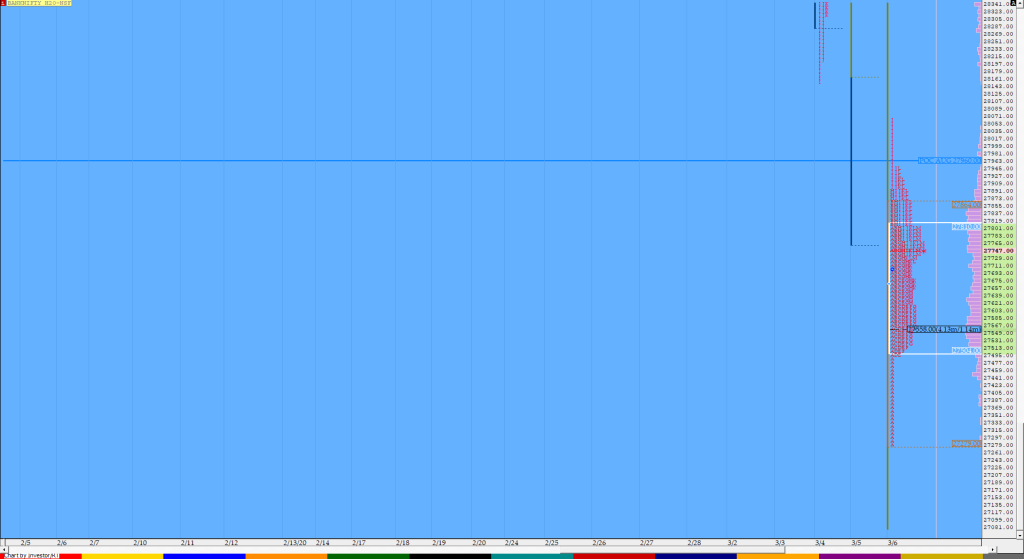
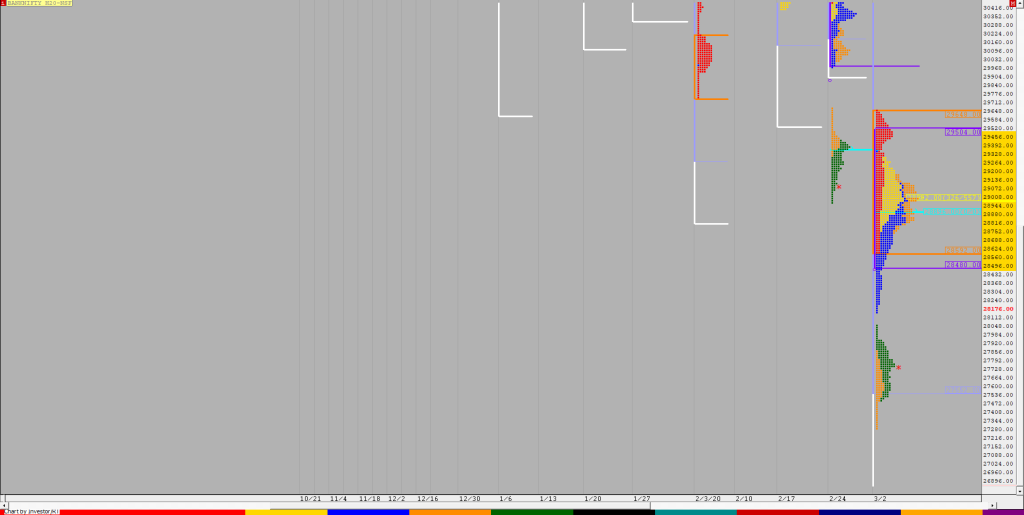
Market Profile Analysis dated 6th Mar 2020

Nifty Mar F: 10940 [ 10999 / 10830 ] HVNs – 10911 / 10940 / (11105) / (11145) / 11165-175 / (11250) / 11270-290 / (11340-360) / 11580 Report to be updated… The NF Open was an Open Auction Out of Range (OAOR) The day type was a Neutral Day (NeuD) Largest volume was traded at […]
Order Flow charts dated 9th Mar 2020

Many traders are used to viewing volume as a histogram beneath a price chart. But the Order Flow approach shows the amount of volume traded during each price bar, and also it breaks this volume down into the Volume generated by the Buyers and the Volume generated by the sellers again at every row of […]
Order Flow charts dated 9th Mar 2020 (5 mins)

Order Flow can show how a collection of market participates has acted in the past and this helps to create profit by knowing if these traders are profitable or caught upside down. NF BNF
Weekly charts (02nd to 06th Mar 2020) and Market Profile Analysis

Nifty Spot Weekly Profile (02nd to 06th Mar 2020) Spot Weekly – 10989 [ 11433/ 10827 ] Previous week’s profile (24th to 28th Feb) was a trending one to the downside with an initiative tail from 11981 to 12071 giving a huge range of 838 points with each day forming lower Value than the previous […]
