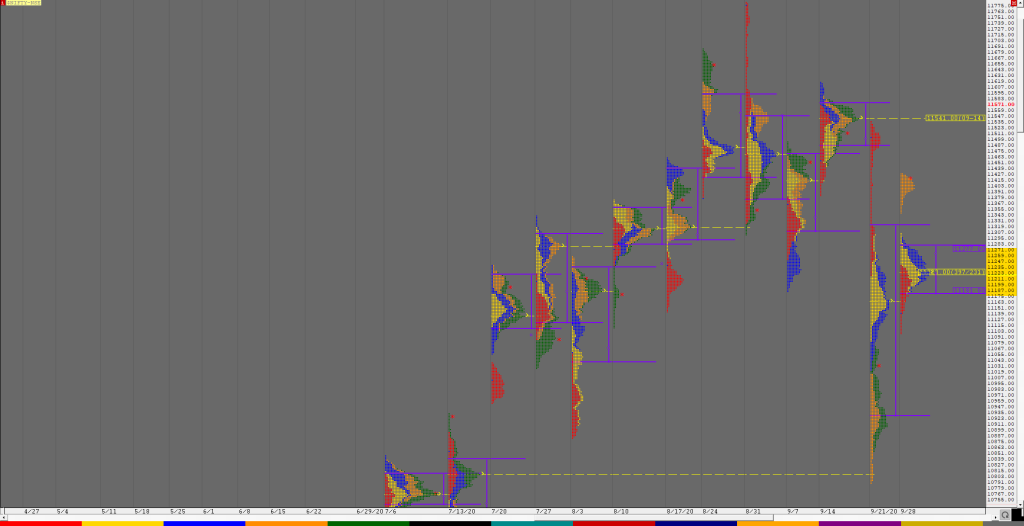
Order Flow charts dated 08th October 2020

Many traders are used to viewing volume as a histogram beneath a price chart. But the Order Flow approach shows the amount of volume traded during each price bar, and also it breaks this volume down into the Volume generated by the Buyers and the Volume generated by the sellers again at every row of […]
Market Profile Analysis dated 07th October 2020

Nifty Oct F: 11751 [ 11779 / 11638 ] NF opened in the spike zone and made a test below the spike low of 11659 as it hit 11638 but was swiftly rejected as it left a buying tail in the IB (Initial Balance) from 11686 to 11638 and continued the imbalance it has been […]
