Participantwise net Open Interest and net equity investments – 20th MAR 2023
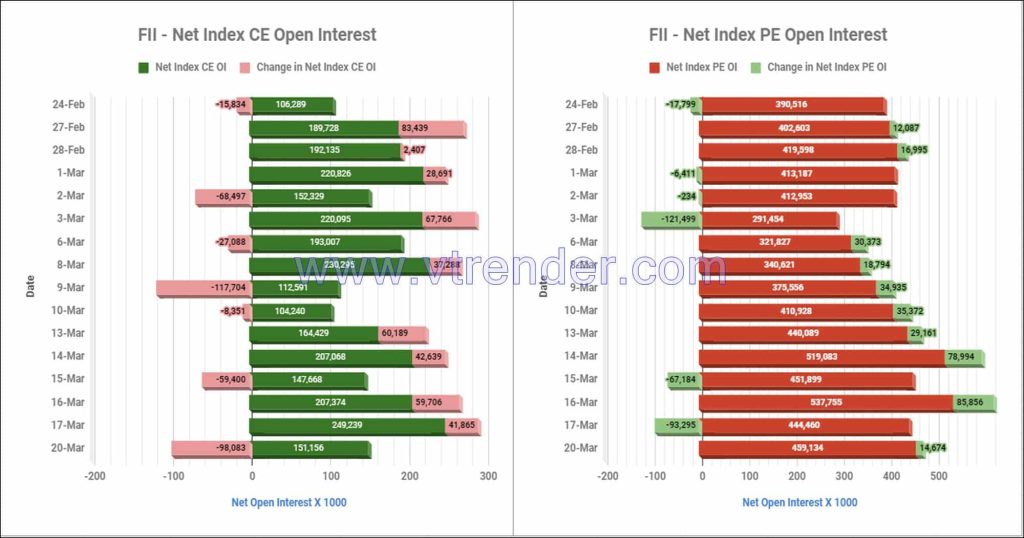
Participantwise total outstanding Open Interest & Daily changes
Nifty and Banknifty Futures with all series combined Open Interest – 20th MAR 2023
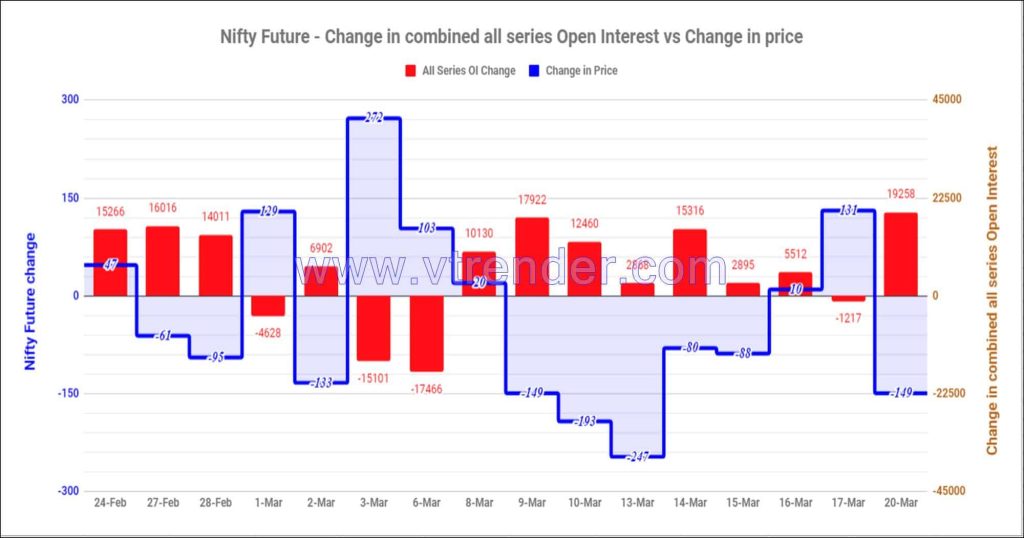
Total Nifty/Banknifty OI and daily OI changes
Desi MO (McClellans Oscillator for NSE) – 20th MAR 2023
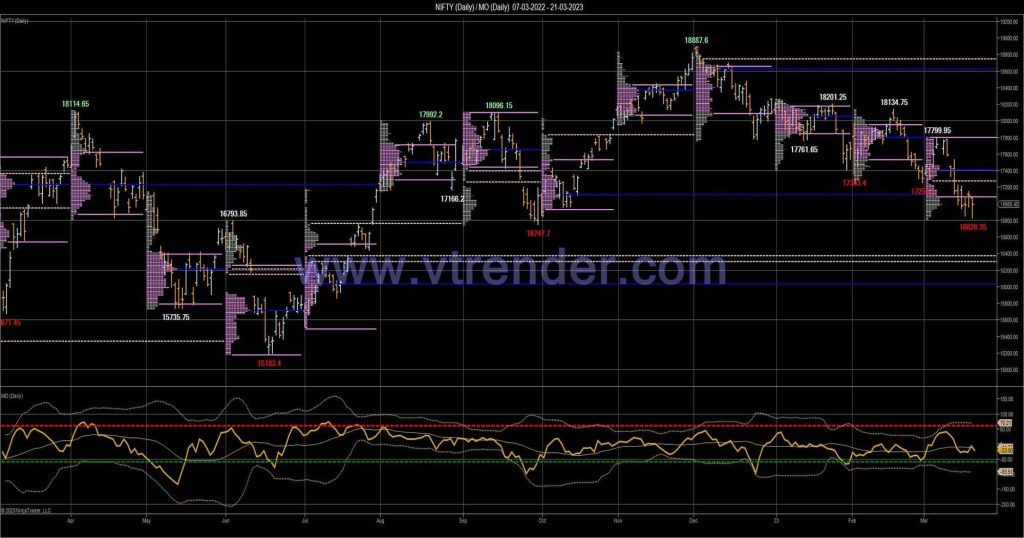
MO at -23 McClellan’s Oscillator – Calculation and Interpretation
Order Flow charts dated 20th March 2023
Many traders are used to viewing volume as a histogram beneath a price chart. But the Order Flow approach shows the amount of volume traded during each price bar, and also it breaks this volume down into the Volume generated by the Buyers and the Volume generated by the sellers again at every row of […]
Market Profile Analysis dated 17th Mar 2023
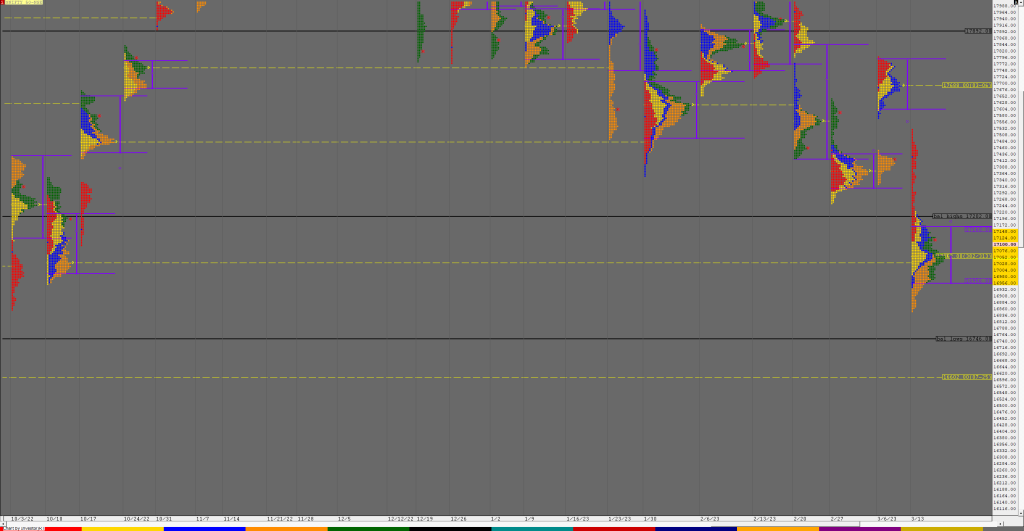
Nifty Mar F: 17178 [ 17208 / 17020 ] NF opened with a gap up of almost 120 points right at the weekly reference of 17165 and even went on to make a swipe higher to 17203 but was swiftly rejected as it not only broke below the day’s VWAP but went on to make new […]
Weekly Charts (13th to 17th Mar 2023) and Market Profile Analysis
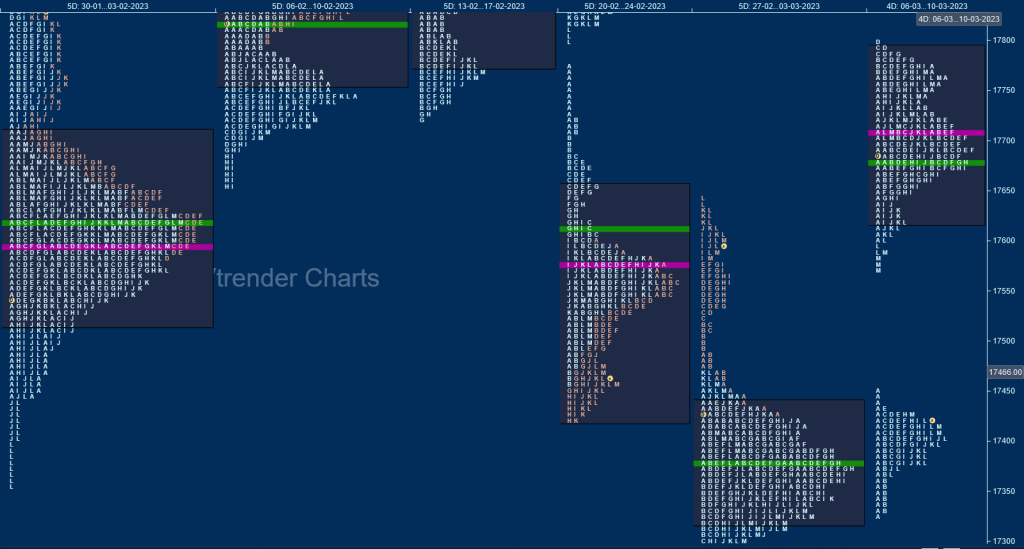
Nifty Spot Weekly Profile (13th to 17th Mar 2023) 17100 [ 17529 / 16850 ] Previous week’s report ended with this ‘The weekly profile is a Double Distribution One to the Downside though Value was completely higher at 17617-17708-17794 as it began with last week’s buyers booking profit at 17761 on Monday after which it […]
