Desi MO (McClellans Oscillator for NSE) – 8th MAR 2023
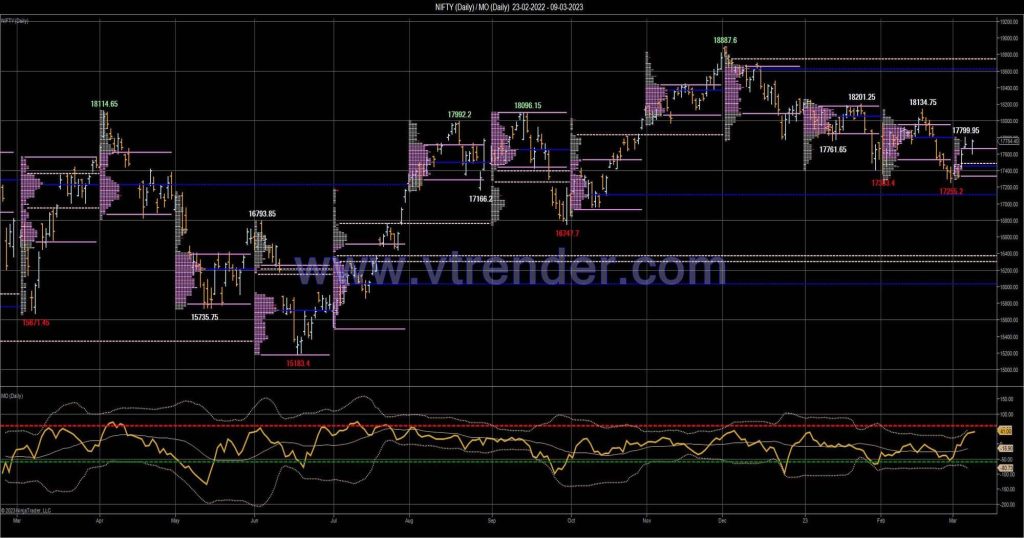
MO at 41 McClellan’s Oscillator – Calculation and Interpretation
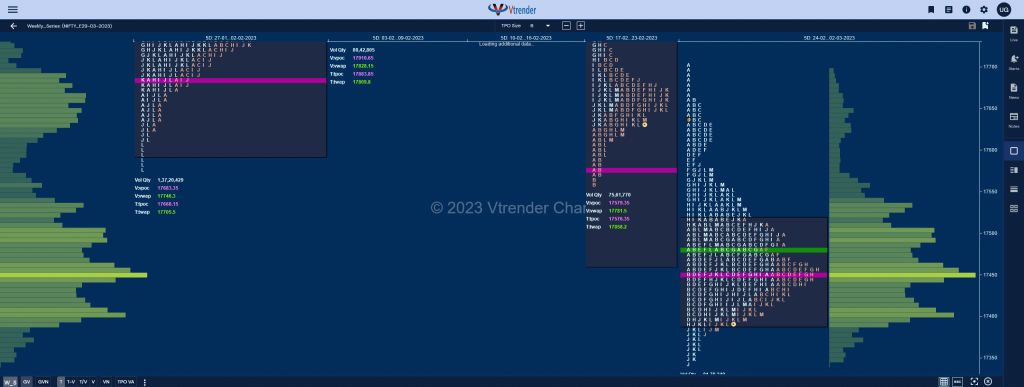
Weekly Charts (27th Feb to 03rd Mar 2023) and Market Profile Analysis
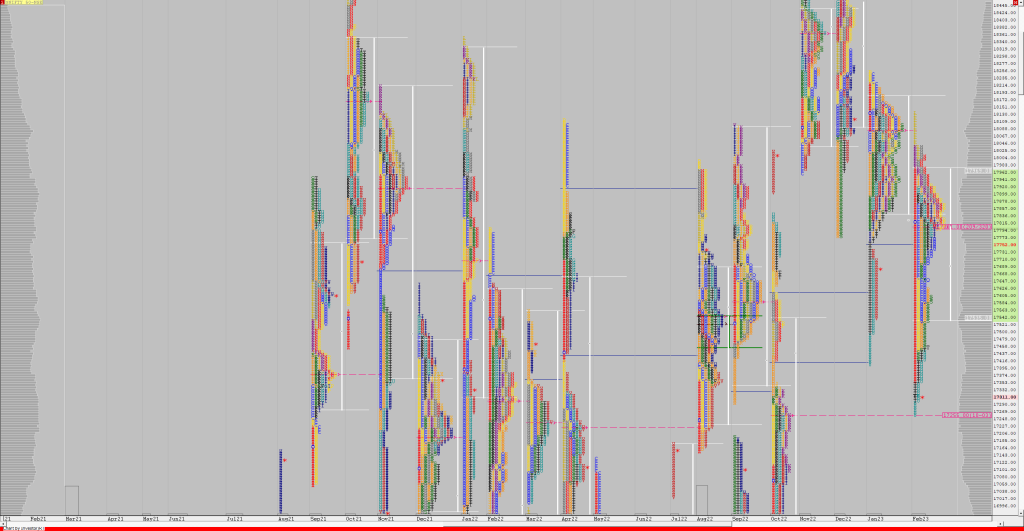
Nifty Spot Weekly Profile (27th Feb to 03rd Mar 2023) 17594 [ 17644 / 17255 ] Previous week’s report ended with this ‘The weekly profile is a trending one to the downside making lower highs & lower lows on all 5 days but profile wise resembles a DD (Double Distribution) with mostly lower Value at […]
Market Profile Analysis dated 06th Mar 2023
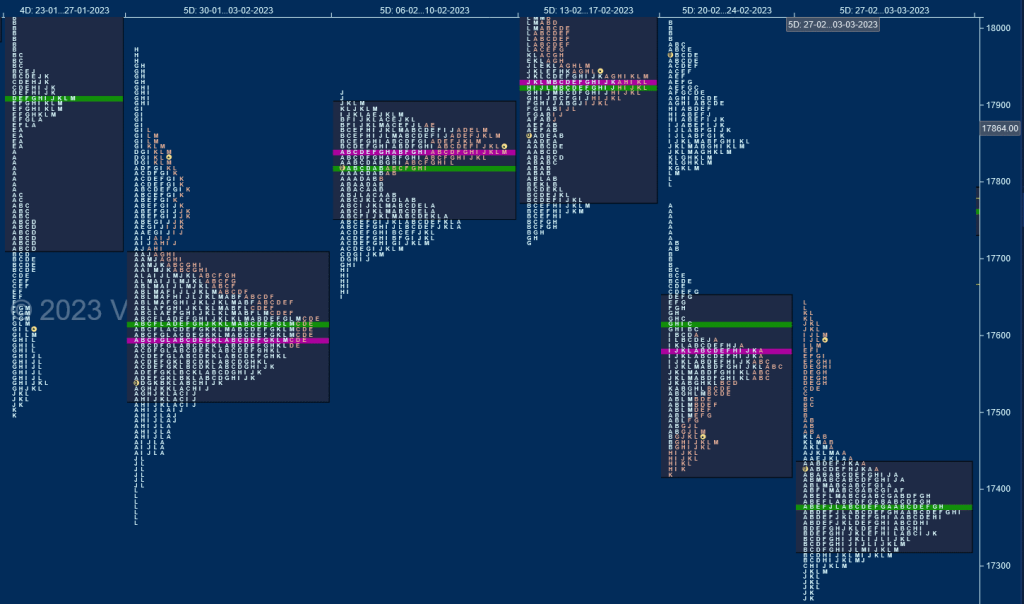
Nifty Mar F: 17775 [ 17864 / 17724 ] NF not only opened above previous high but continued the Trend Day imbalance with another Open Drive Up as it tagged the February 2023 Monthly POC of 17839 in the IB (Initial Balance) while leaving a long A period buying tail from 17818 to 17724. The auction […]
Nifty and Banknifty Futures with all series combined Open Interest – 6th MAR 2023
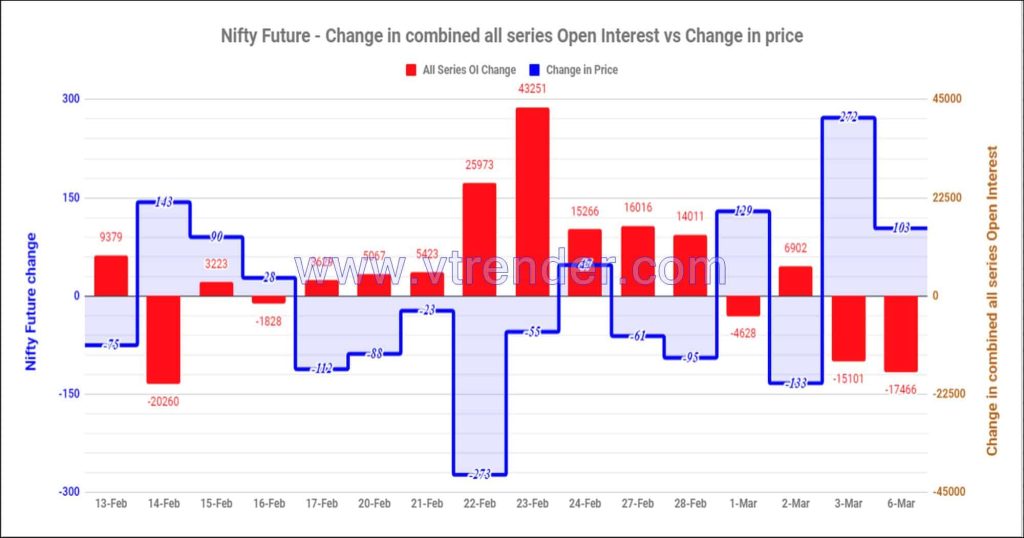
Total Nifty/Banknifty OI and daily OI changes
Participantwise net Open Interest and net equity investments – 6th MAR 2023
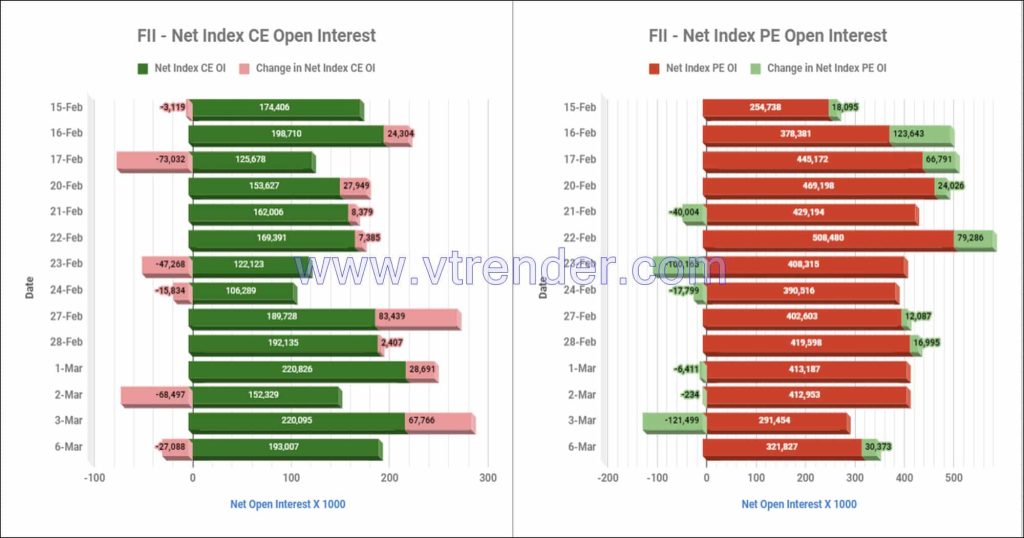
Participantwise total outstanding Open Interest & Daily changes
Desi MO (McClellans Oscillator for NSE) – 6th MAR 2023
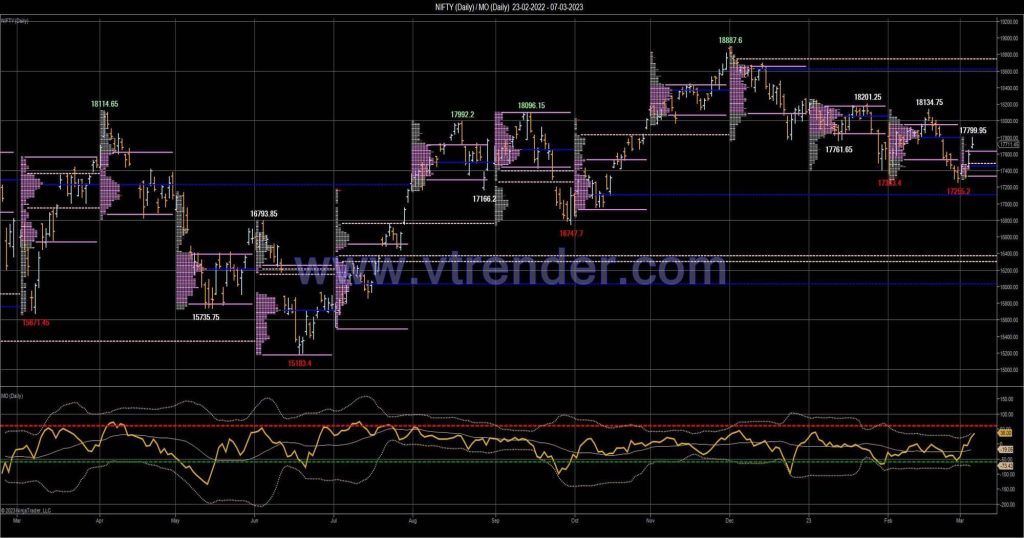
MO at 36 McClellan’s Oscillator – Calculation and Interpretation
Monthly charts (February 2023) and Market Profile Analysis
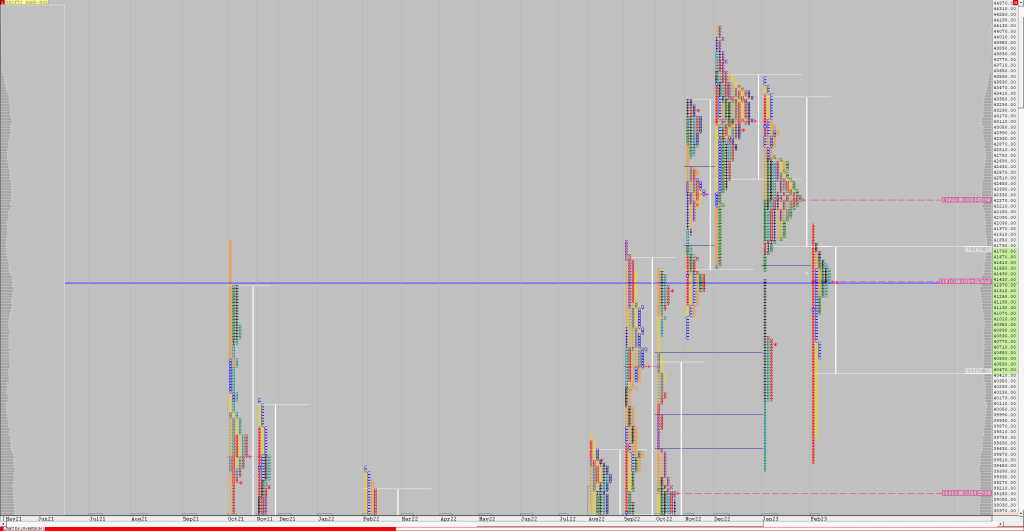
Nifty Spot – 17304 [ 18134 / 17255 ] Monthly Profile (February 2023) Previous month’s report ended with this ‘The monthly profile remained below December 2022’s VWAP of 18337 and was a nice balanced one for most part before it made a move away from the monthly Value of 17845-17132-18186 on the last 3 days leaving a Normal […]
Order Flow charts dated 06th March 2023
Many traders are used to viewing volume as a histogram beneath a price chart. This approach shows the amount of volume traded below the price Bar. The Order Flow approach is to see the Volume traded inside or within the price bar, an important distinction. Order Flow trading is thinking about what order market participants […]
Market Profile Analysis dated 03rd Mar 2023
Nifty Mar F: 17671 [ 17725 / 17475 ] NF opened with a gap up of 91 points trapping all the laggard shorts of previous close who were forced to exit which was then followed by some initiative buying as it confirmed an Open Drive and a move away from the 4-day balance it had formed […]
Nifty 50 Monthly and Annual returns (1991-2023) updated 3rd Mar 2023
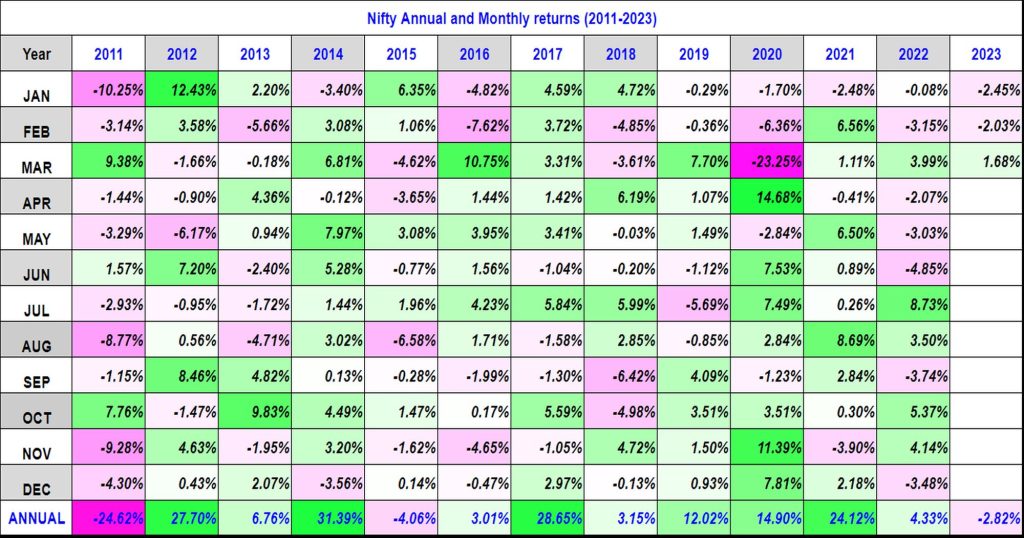
Nifty 50 returns (1991-2000)
