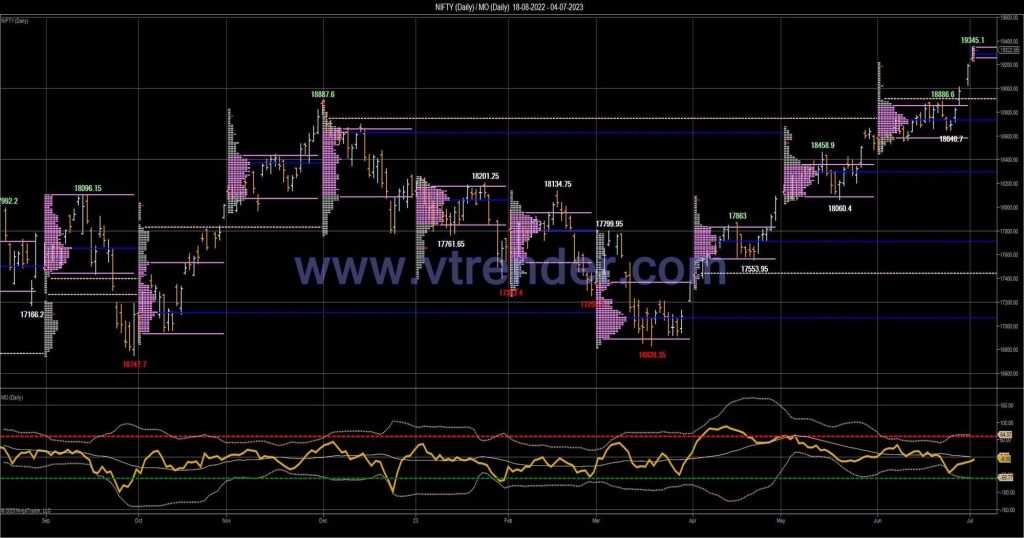
Desi MO (McClellans Oscillator for NSE) – 3rd JUL 2023

MO at -6 McClellan’s Oscillator – Calculation and Interpretation
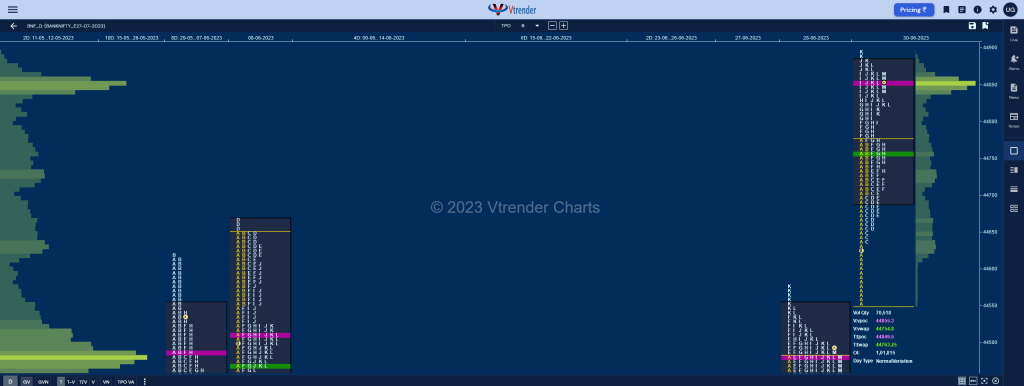
Weekly Charts (26th to 30th Jun 2023) and Market Profile Analysis

Nifty Spot Weekly Profile (26th to 30th Jun 2023) 19189 [ 19201 / 18646 ] Previous week’s report ended with this ‘The weekly profile is a Neutral Extreme one to the downside with overlapping to higher Value at 18728-18853-18875 and is marked with the 2 FAs of 18660 to the downside & 18886 on the […]
Order Flow charts dated 03rd July 2023
Many traders are used to viewing volume as a histogram beneath a price chart. But the Order Flow approach shows the amount of volume traded during each price bar, and also it breaks this volume down into the Volume generated by the Buyers and the Volume generated by the sellers again at every row of […]
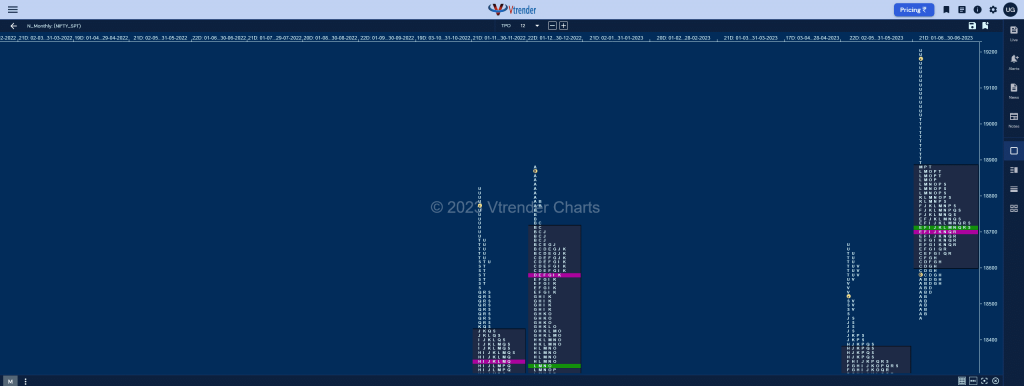
Monthly charts (June 2023) and Market Profile Analysis

Nifty Spot – 19189 [ 19201 / 18464 ] Monthly Profile (June 2023) Previous month’s report ended with this ‘The Monthly profile is a Normal Variation one to the upside which completely the 2IB objective of 18493 hence forming completely higher Value at 18106-18270-18372 which was a nice balance for most part of May before it made a […]
