Order Flow charts dated 13th September 2023

A good trader is a one who can make money consistently over a longer period of time. But how to become one such trader, who can make money in any type of market condition? A good trader keeps a close watch on the current information of the market and assesses it for change against previous […]
Market Profile Analysis dated 12th September 2023
Nifty Sep F: 20046 [ 20133 / 19970 ] NF opened with a gap up of 76 points and even went on to tag the 27th Jul Extension Handle of 20127 while making a high of 20133 in the opening minutes but failed to get fresh demand which encouraged the sellers to strike which they did […]
Order Flow charts dated 12th September 2023

Many traders are used to viewing volume as a histogram beneath a price chart. This approach shows the amount of volume traded below the price Bar. The Order Flow approach is to see the Volume traded inside or within the price bar, an important distinction. Order Flow trading is thinking about what order market participants […]
Weekly Spot Charts (04th to 08th Sep 2023) and Market Profile Analysis
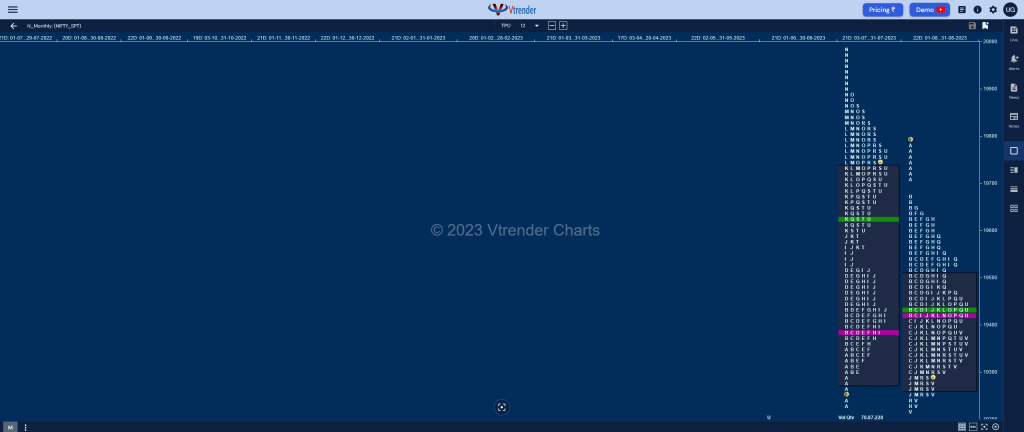
Nifty Spot Weekly: 19820 [ 19867 / 19432 ] Previous week’s profile was a Neutral Extreme Up one with overlapping to lower Value at 19280-19340-19361 and an ultra prominent POC at 19340 from where it made a move away on the last day with a hat-trick of extension handles at 19350, 19373 & 19406 confirming a […]
Market Profile Analysis dated 11th September 2023
Nifty Sep F: 20036 [ 20051 / 19892 ] NF opened higher and went on to scale above the 2-day VPOC of 19933 and tag the VAH of 19964 to the dot in the A period after which it left an extension handle right there to make a higher high of 19993 in the B forming […]
Order Flow charts dated 11th September 2023

Many traders are looking for information on how to use market conditions to find good trades. Order Flow is best understood as a way to see existing bias in the markets. Order Flow helps us understand who is in control of the market and who is ‘upside down’ and likely to make exits from that […]
Market Profile Analysis dated 08th September 2023
Nifty Sep F: 19872 [ 19916 / 19772 ] NF continued the Trend Day’s imbalance by opened higher as it not only got above 09th Aug’s Swing High of 19806 but tested the initiative selling tail of 02nd Aug which was from 19838 to 19888 as it made a high of 19852 in the A period […]
Order Flow charts dated 08th September 2023

Many traders are used to viewing volume as a histogram beneath a price chart. But the Order Flow approach shows the amount of volume traded during each price bar, and also it breaks this volume down into the Volume generated by the Buyers and the Volume generated by the sellers again at every row of […]
Market Profile Analysis with Weekly Settlement Report dated 07th September 2023
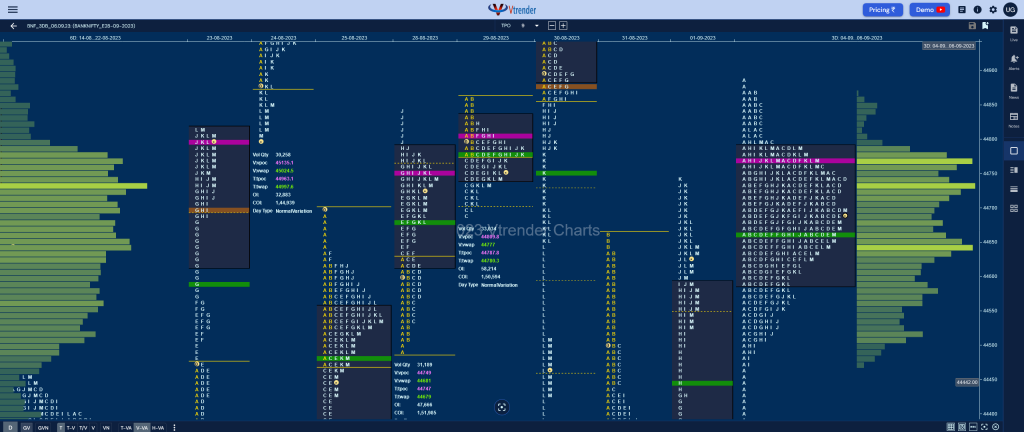
Nifty Sep F: 19768 [ 19788 / 19601 ] NF did not give a follow up to the NeuX close as it opened lower well below the yPOC of 19668 and went on to swipe lower in the 2-day Value making a low of 19601 in the A period stopping right at the VAL of the […]
Order Flow charts dated 07th September 2023

When we think about how to measure volume in the market one of the keys is Order Flow. It plays a role by telling us what the other traders have done in the market and are currently doing and this provides valuable clues and potential opportunities to trade. An Order Flow trader can actually see […]
