Order Flow charts dated 31st August 2023

Many traders are used to viewing volume as a histogram beneath a price chart. This approach shows the amount of volume traded below the price Bar. The Order Flow approach is to see the Volume traded inside or within the price bar, an important distinction. Order Flow trading is thinking about what order market participants […]
Market Profile Analysis dated 30th August 2023
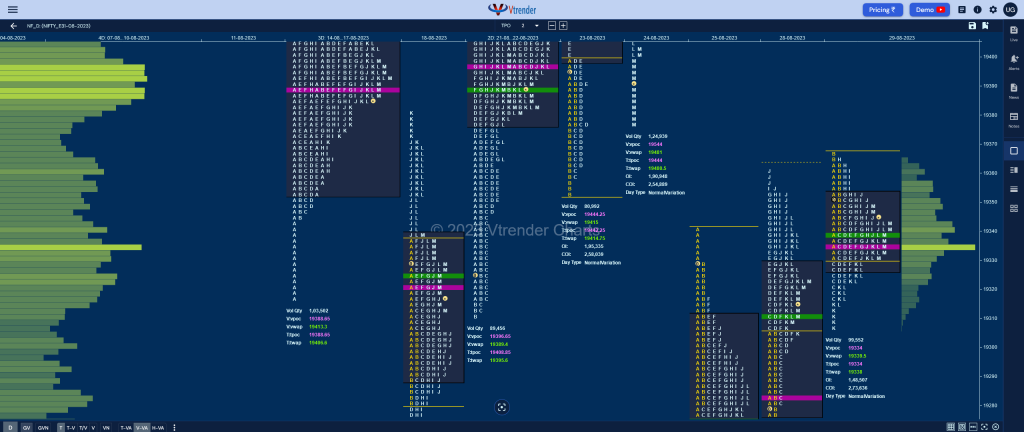
Nifty Aug F: 19342 [ 19444 / 19329 ] NF opened with a gap up above the HVN of 19396 and went on to tag 24th Aug’s extension handle of 19430 while making a high of 19436 in the A period after which it settled down into an OAOR as could only manage marginal new highs […]
Order Flow charts dated 30th August 2023

Many traders are looking for information on how to use market conditions to find good trades. Order Flow is best understood as a way to see existing bias in the markets. Order Flow helps us understand who is in control of the market and who is ‘upside down’ and likely to make exits from that […]
Market Profile Analysis dated 29th August 2023
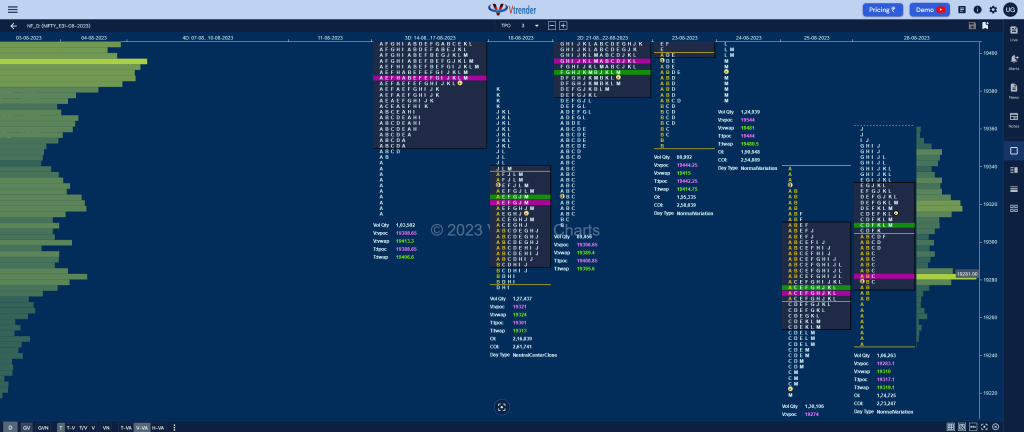
Nifty Aug F: 19337 [ 19366 / 19306 ] NF opened slightly higher but settled down into an OA (Open Auction) as it formed an ultra narrow 36 point range in the IB (Initial Balance) where it made attempts in both the TPOs to scale above PBH but could only manage marginal new highs of 19363 […]
Order Flow charts dated 29th August 2023

Many traders are used to viewing volume as a histogram beneath a price chart. But the Order Flow approach shows the amount of volume traded during each price bar, and also it breaks this volume down into the Volume generated by the Buyers and the Volume generated by the sellers again at every row of […]
Market Profile Analysis dated 28th August 2023
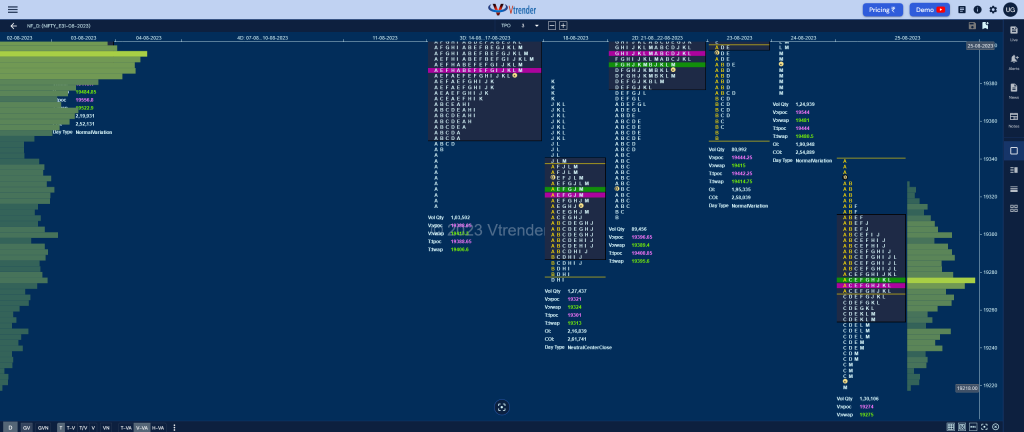
Nifty Aug F: 19321 [ 19361 / 19247 ] NF made an OAIR start probing below previous Value but could only manage to tag 19247 where it got rejected indicating it wanted to remain in the Gaussian Curve as it left an initiative buying tail till 19269 and went on to make a C side extension […]
Order Flow charts dated 28th August 2023
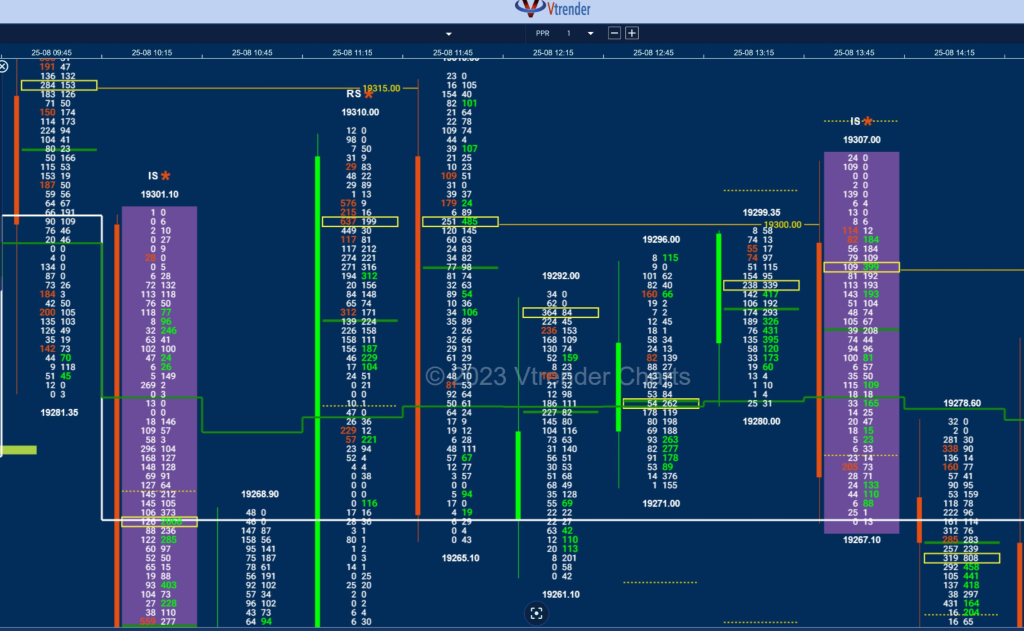
When we think about how to measure volume in the market one of the keys is Order Flow. It plays a role by telling us what the other traders have done in the market and are currently doing and this provides valuable clues and potential opportunities to trade. An Order Flow trader can actually see […]
Market Profile Analysis dated 25th August 2023

Nifty Aug F: 19250 [ 19340 / 19218 ] NF continued the Trend Day imbalance with a gap down open and remained below the 19341 reference from 21st Aug as it went on to re-visit the FA of 19275 and repaired the poor lows there by hitting 19270 but settlend down into an OAOR (Open Auction […]
Order Flow charts dated 25th August 2023
The key to using Order Flow trading is to determine market depth. This describes the places where Market participants have taken positions or the zone they have transacted. The Order Flow is like a list of trades and helps to know how other traders are placed in the market. Vtrender helps you to stay on […]
Market Profile Analysis with Weekly Settlement Report dated 24th August 2023
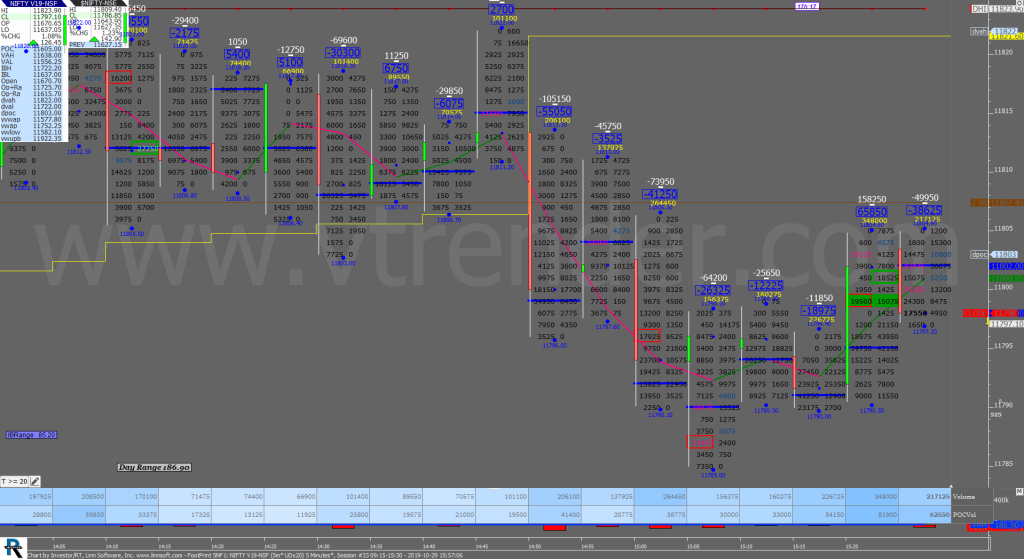
Nifty August F: 19390 [ 19575 / 19376 ] NF not only made a higher open but continue to drive up completing the 2 ATR target of 19573 from the FA (Failed Auction) of 19275 while making a high of 19575 in the B period. However, the strong open got neutralised as the C side broke […]
