Market Profile Analysis with Weekly Settlement Report dated 17th August 2023
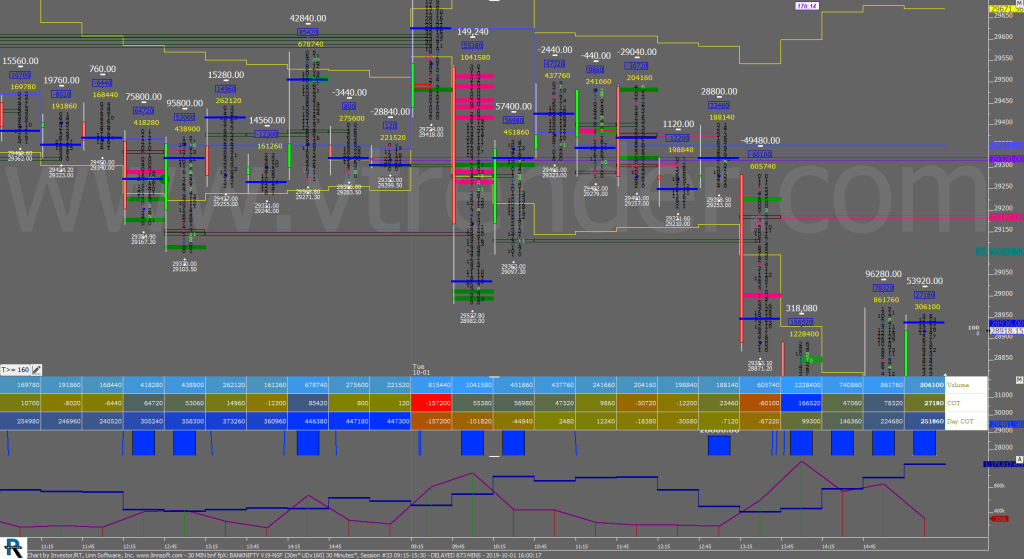
Nifty August F: 19393 [ 19463 / 19360 ] NF opened lower and stalled just below the yPOC of 19468 as it made a high of 19463 and went on to probe lower for the rest of the IB (Initial Balance) as it broke below yVWAP of 19429 and made a low of 19393 from where […]
Order Flow charts dated 17th August 2023
Many traders are used to viewing volume as a histogram beneath a price chart. But the Order Flow approach shows the amount of volume traded during each price bar, and also it breaks this volume down into the Volume generated by the Buyers and the Volume generated by the sellers again at every row of […]
Market Profile Analysis dated 16th August 2023
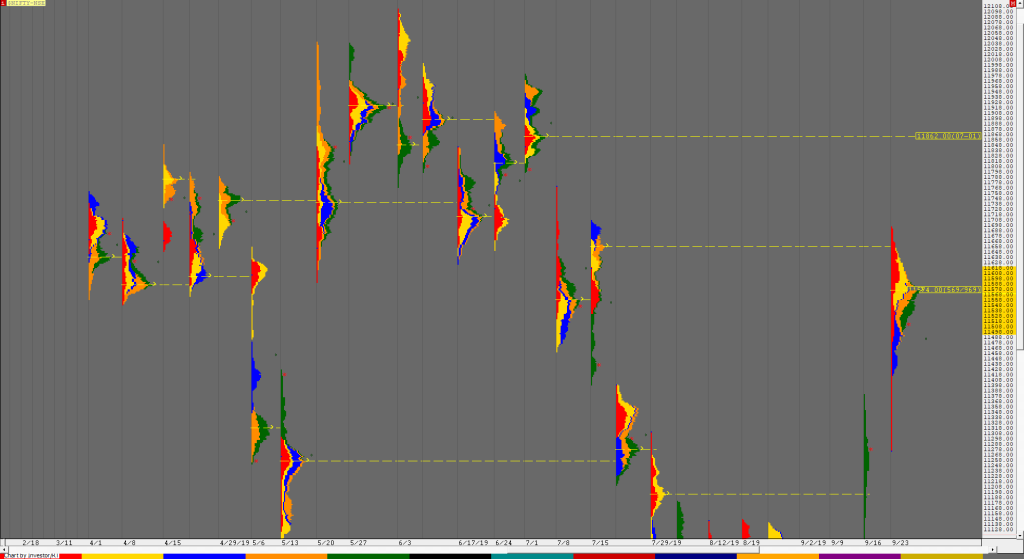
Nifty August F: 19484 [ 19505 / 19352 ] NF opened with a gap down below previous session’s VWAP of 19410 and continued to probe lower as it hit 19352 taking support just above the A period buying tail from 19345 to 19316 marking the end of the downside for the day as it went on […]
Order Flow charts dated 16th August 2023
When we think about how to measure volume in the market one of the keys is Order Flow. It plays a role by telling us what the other traders have done in the market and are currently doing and this provides valuable clues and potential opportunities to trade. An Order Flow trader can actually see […]
Market Profile Analysis dated 14th August 2023
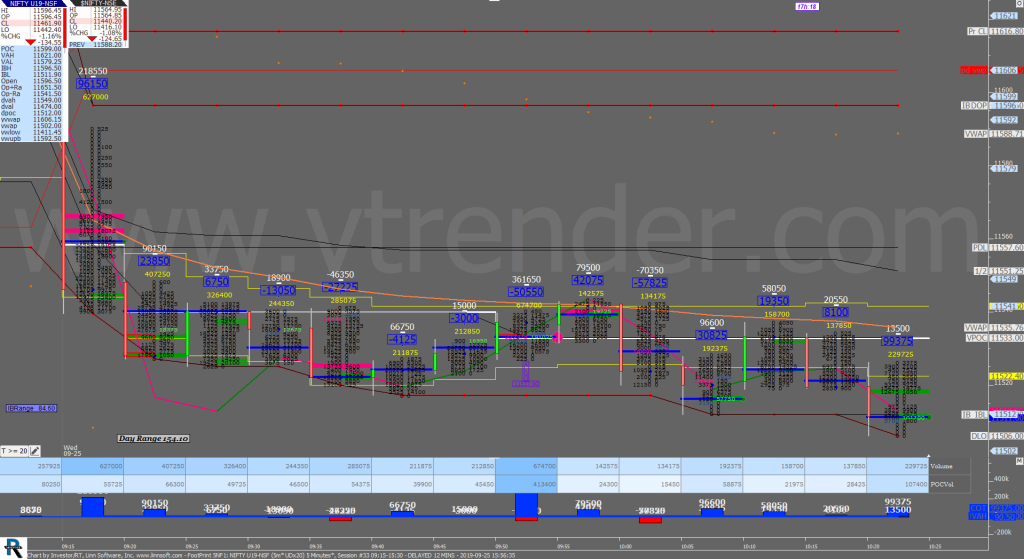
Nifty August F: 19478 [ 19506 / 19316 ] NF not only opened lower but continued to drive down breaking below the 03rd Jul’s Gap mid-point of 19381 and the 30th Jun’s extension handle of 19339 as it made a low of 19316 in the A period where it saw big profit booking by the sellers […]
Order Flow charts dated 14th August 2023
The key to using Order Flow trading is to determine market depth. This describes the places where Market participants have taken positions or the zone they have transacted. The Order Flow is like a list of trades and helps to know how other traders are placed in the market. Vtrender helps you to stay on […]
Market Profile Analysis dated 11th August 2023

Nifty August F: 19504 [ 19600 / 19488 ] NF gave an initiative move away from the 4-day composite even breaking below the weekly HVN of 19530 as it made a low of 19504 in the IB and left a long A period selling tail from 19535 to 19600 and consolidated in the C period forming […]
Weekly Spot Charts (07th to 11th Aug 2023) and Market Profile Analysis
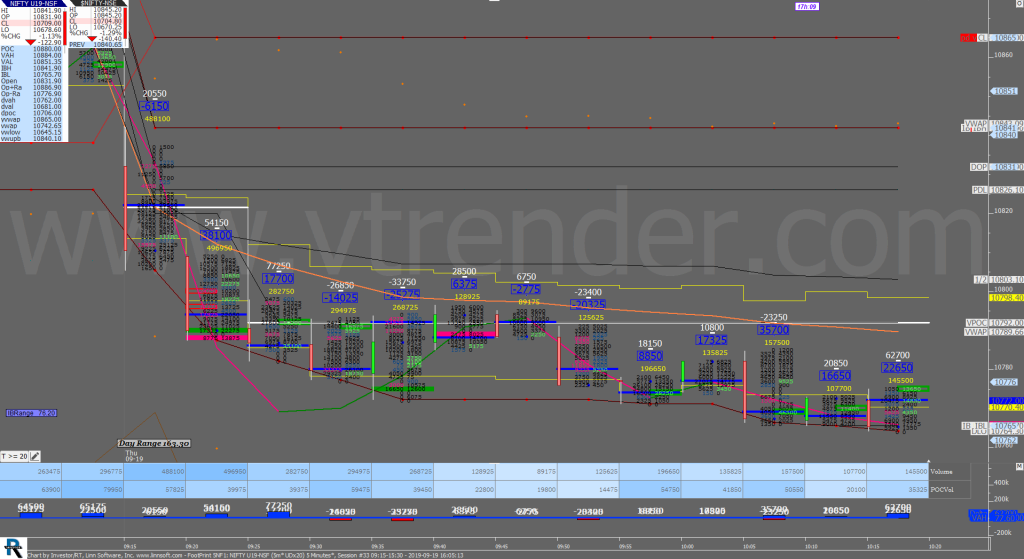
Nifty Spot Weekly Profile (07th to 11th Aug 2023) 19428 [ 19645 / 19412 ] ‘Previous week’s profile was a Neutral Extreme one to the downside plus also resembled a Double Distribution (DD) One as it remained below the POC of 19802 forming mostly lower Value at 19297-19479-19669 as it broke below the weekly VPOC […]
Monthly charts (July 2023) and Market Profile Analysis
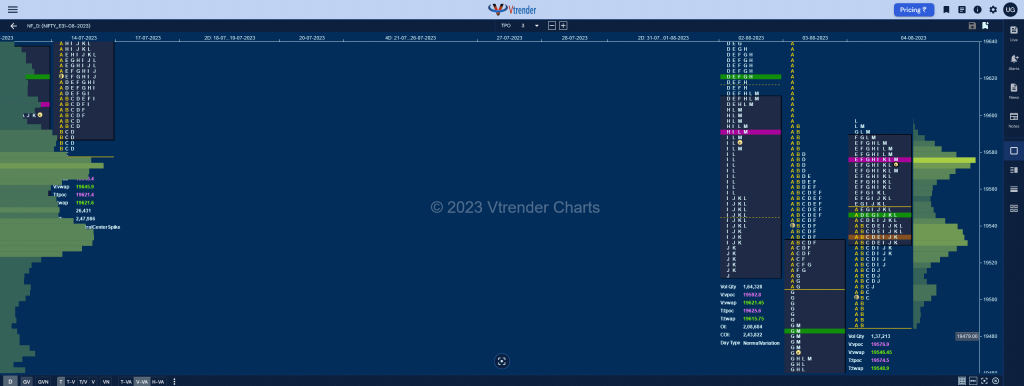
Nifty Spot –19753 [ 19992 / 19236 ] Monthly Profile (July 2023) Previous month’s report ended with this ‘The Monthly profile is also a Trend One Up with completely higher Value at 18609-18707-18876 which was forming a balance for the most part of June but has given a huge move away on the last 2 days leaving […]
Order Flow charts dated 11th August 2023
Trading Order Flow allows a trader to see the specific price where a trade has hit the market, along with the volume of that trade. This information is extremely valuable and allows a trader to generate substantial revenue by using this information to trade. The way we see it is that Order Flow trading is […]
