Market Profile Analysis with Weekly Settlement Report dated 10th August 2023
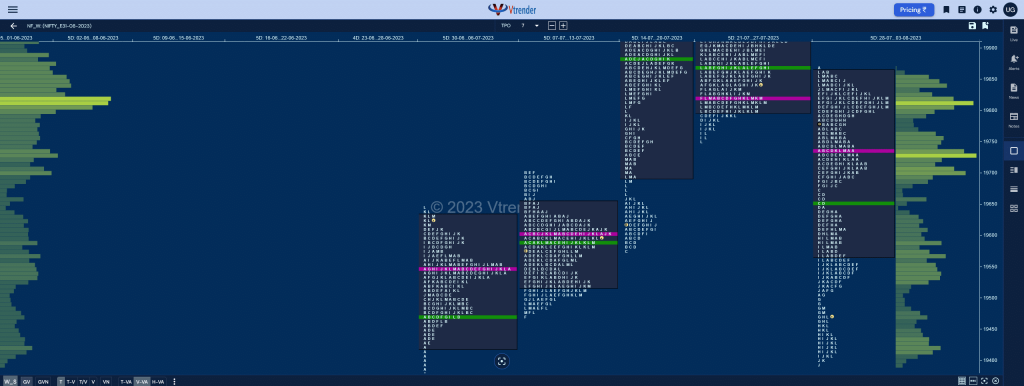
Nifty August F: 19596 [ 19669 / 19535 ] NF opened lower not giving a follow up to the NeuX (Neutral Extreme) profile which was expected but also went on to break below the VWAP of 19599 triggering a drop down to 19535 with a big C side extension as it tested the SOC (Scene Of […]
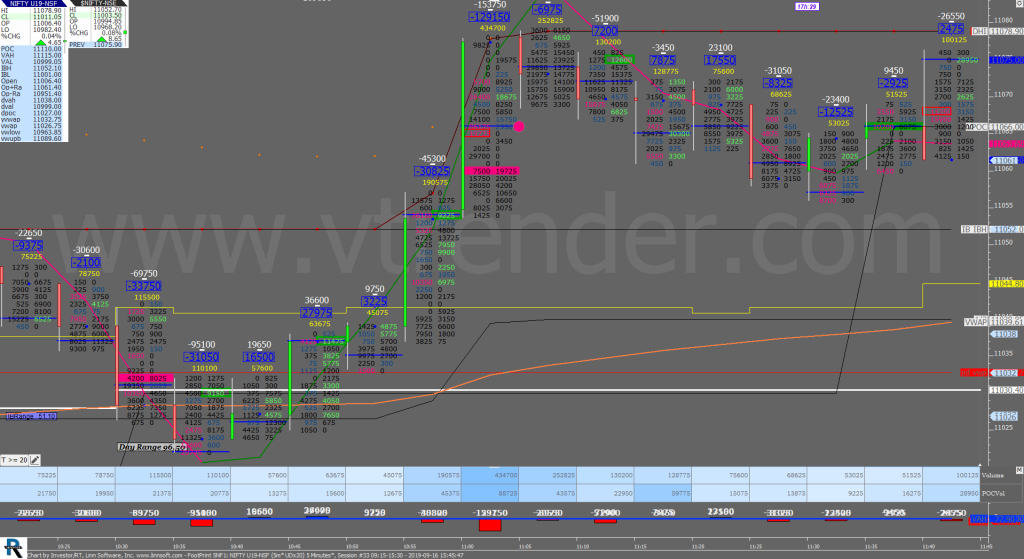
Order Flow charts dated 10th August 2023
Timing is the key to successfully trade the markets in the shorter time frame. Order Flow is one of the most effective methods to time your trades by seeing exactly what the other traders are trading in the market and positioning your bias accordingly. Order Flow is the most transparent way to trade and takes […]
Market Profile Analysis dated 09th August 2023
Nifty August F: 19689 [ 19702 / 19512 ] NF made a Drive like open moving away from yPOC of 19609 not only breaking below previous lows and tagging the 04th Aug’s VPOC of 19576 but went on to make a low of 19547 almost testing that day’s VWAP in the A period itself after which […]
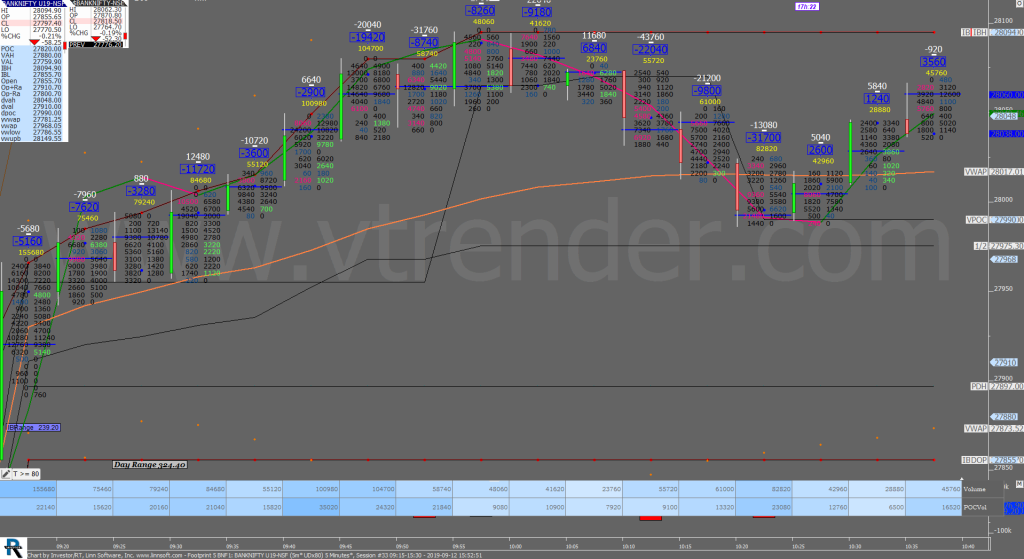
Order Flow charts dated 09th August 2023
A good trader is a one who can make money consistently over a longer period of time. But how to become one such trader, who can make money in any type of market condition? A good trader keeps a close watch on the current information of the market and assesses it for change against previous […]
Market Profile Analysis dated 08th August 2023
Nifty August F: 19611 [ 19682 / 19585 ] NF made another OAIR (Open Auction In Range) start which was also an OH (Open=High) at 19682 confirming that the sellers were still active in this zone as it left an A period selling tail and went on to make couple of REs (Range Extension) lower as […]
Order Flow charts dated 08th August 2023

Many traders are used to viewing volume as a histogram beneath a price chart. This approach shows the amount of volume traded below the price Bar. The Order Flow approach is to see the Volume traded inside or within the price bar, an important distinction. Order Flow trading is thinking about what order market participants […]
Market Profile Analysis dated 07th August 2023
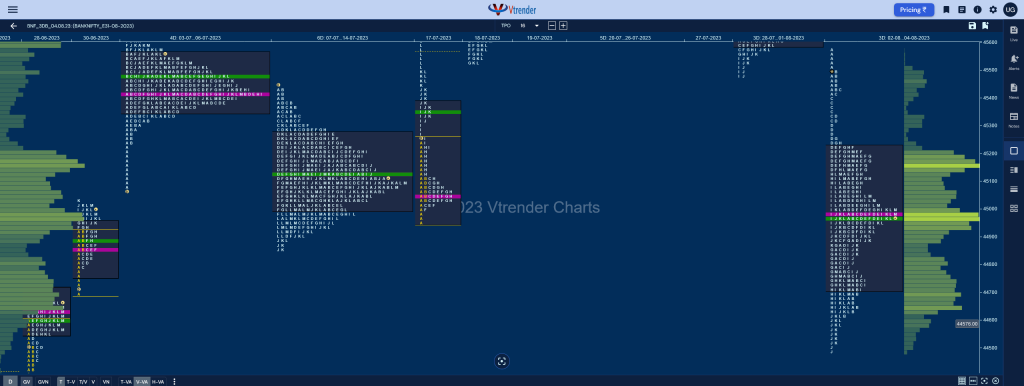
Nifty August F: 19661 [ 19684 / 19577 ] NF made an OAOR (Open Auction Out of Range) start taking support just above the yPOC of 19576 indicating that the PLR (Path of Least Resistance) was to the upside as it formed a narrow 48 point range IB (Initial Balance) stalling around the 02nd Aug’s Trend […]
Order Flow charts dated 07th August 2023
Many traders are looking for information on how to use market conditions to find good trades. Order Flow is best understood as a way to see existing bias in the markets. Order Flow helps us understand who is in control of the market and who is ‘upside down’ and likely to make exits from that […]
Market Profile Analysis dated 04th August 2023
Nifty August F: 19468 [ 19647 / 19390 ] NF opened higher but was still an OAIR (Open Auction In Range) as it filled up the low volume zone between the DD VWAP of 19485 & HVN of 19533 for the first couple of hours before making a big RE (Range Extension) in the E period […]
Order Flow charts dated 04th August 2023
Many traders are used to viewing volume as a histogram beneath a price chart. But the Order Flow approach shows the amount of volume traded during each price bar, and also it breaks this volume down into the Volume generated by the Buyers and the Volume generated by the sellers again at every row of […]
