Market Profile Analysis with Weekly Settlement Report dated 03rd August 2023

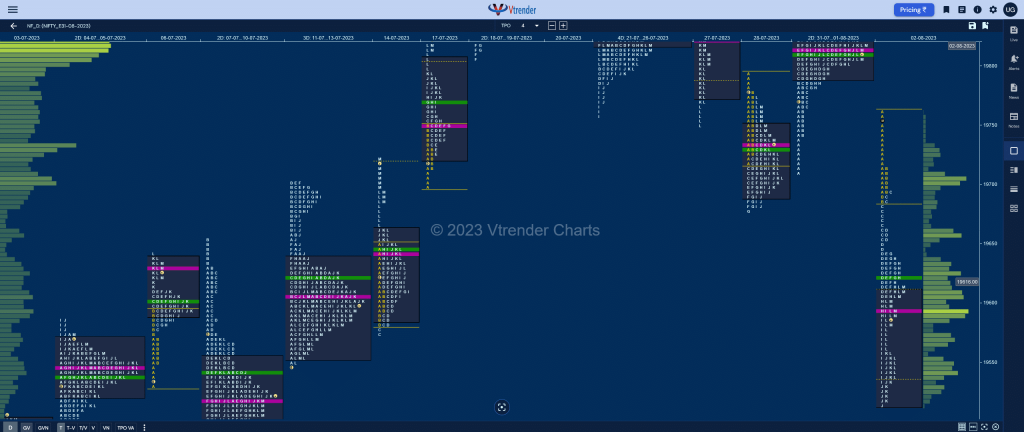
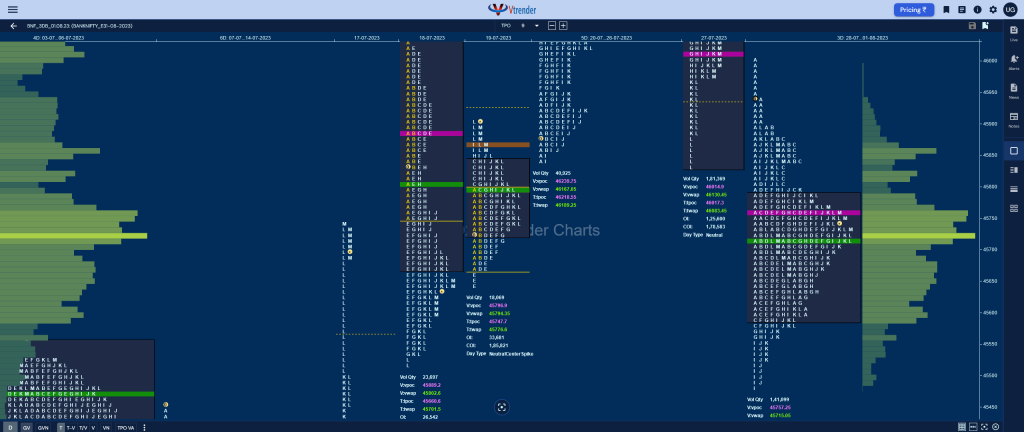
Nifty August F: 19468 [ 19647 / 19390 ] NF made a freak tick of 19647 at open but there were hardly any volumes at that level as it made a probe below PDL hitting 19507 but not sustaining triggering a move back to the yPOC of 19592 where it left similar highs of 19595 & […]
Order Flow charts dated 03rd August 2023
When we think about how to measure volume in the market one of the keys is Order Flow. It plays a role by telling us what the other traders have done in the market and are currently doing and this provides valuable clues and potential opportunities to trade. An Order Flow trader can actually see […]
Market Profile Analysis dated 02nd August 2023

Nifty August F: 19596 [ 19760 / 19514 ] NF not only opened lower moving away from the 2-day balance but also confirmed a Drive Down as it made a high of 19760 and negated the entire buying tail from 31st Jul while making a low of 19687 in the IB (Initial Balance) leaving a fresh […]
Order Flow charts dated 02nd August 2023
The key to using Order Flow trading is to determine market depth. This describes the places where Market participants have taken positions or the zone they have transacted. The Order Flow is like a list of trades and helps to know how other traders are placed in the market. Vtrender helps you to stay on […]
Market Profile Analysis dated 01st August 2023

Nifty August F: 19812 [ 19869 / 19785 ] NF opened with a probe above the spike zone of 19860 but could only manage to hit 19869 as it got back below 19860 settling into an Open Auction (OA) and almost tested the spike lows of 19833 while making a low of 19834 leaving an ultra […]
Order Flow charts dated 01st August 2023
Trading Order Flow allows a trader to see the specific price where a trade has hit the market, along with the volume of that trade. This information is extremely valuable and allows a trader to generate substantial revenue by using this information to trade. The way we see it is that Order Flow trading is […]
Market Profile Analysis dated 31st July 2023

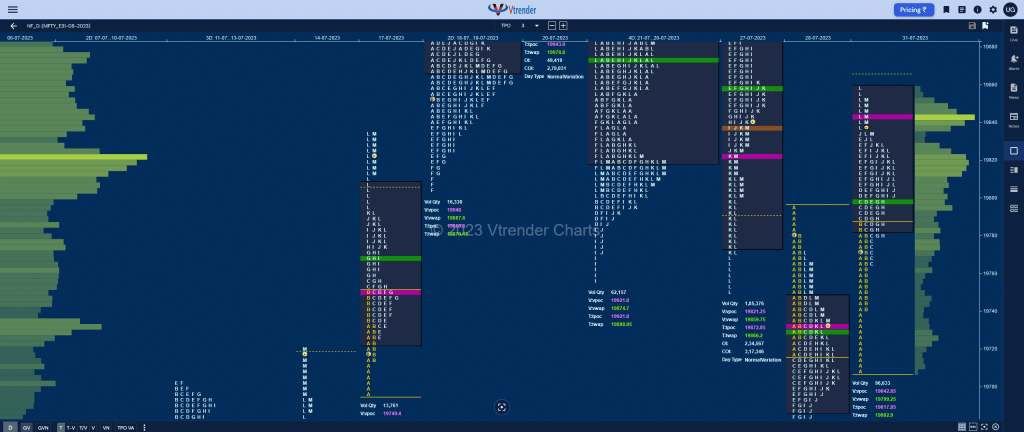
Nifty August F: 19844 [ 19860 / 19708 ] NF opened higher but stalled right at previous session’s selling tail from 19779 triggering a quick probe lower as it swiped through the yPOC of 19733 and looked set to tag the HVN of 19700 but could only manage 19708 as it found some good buying coming […]
Order Flow charts dated 31st July 2023
Timing is the key to successfully trade the markets in the shorter time frame. Order Flow is one of the most effective methods to time your trades by seeing exactly what the other traders are trading in the market and positioning your bias accordingly. Order Flow is the most transparent way to trade and takes […]
Weekly Spot Charts (24th to 28th Jul 2023) and Market Profile Analysis
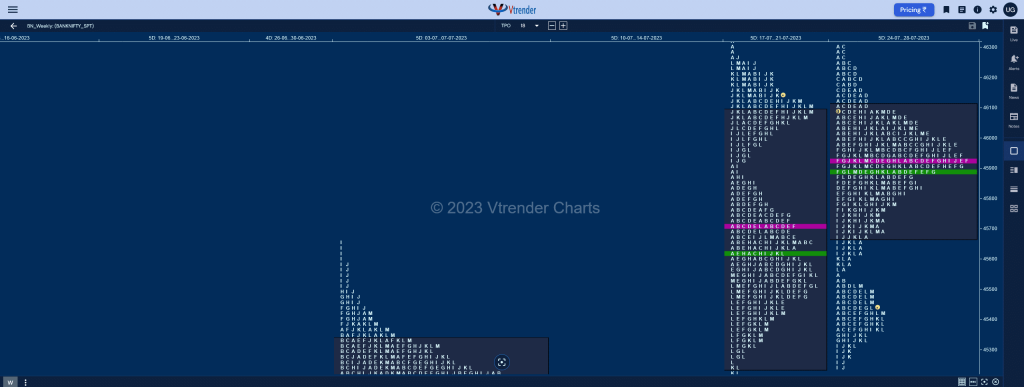
Nifty Spot Weekly Profile (24th to 28th Jul 2023) 19646 [ 19867 / 19563 ] Previous week’s report ended with this ‘The weekly profile is an elongated 429 point range one which left an initiative buying tail from 19587 to 19562 on Monday and made higher highs over the next 2 sessions though with overlapping […]
Market Profile Analysis dated 28th July 2023
Nifty August F: 19751 [ 19795 / 19678 ] NF continued previous session’s Trend Day imbalance with a lower open negating the buying singles from 19771 to 19751 as it went on to tag the 17th Jul VPOC of 19749 and made a low of 19718 in the A period taking support just above that day’s […]
