Market Profile Analysis dated 14th July 2023
Nifty July F: 19598 [ 19627 / 19475 ] NF opened slightly higher and went on to scale above previous day’s VWAP of 19538 and made a high of 19557 in the opening minutes stalling just below the SOC (Scene Of Crime) at 19567 which turned the probe to the downside towards the yPOC of 19480 […]
Weekly Charts (10th to 14th Jul 2023) and Market Profile Analysis
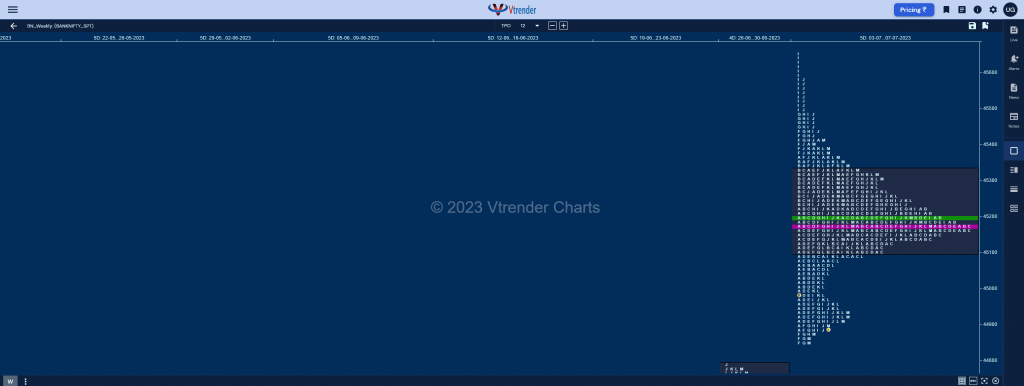
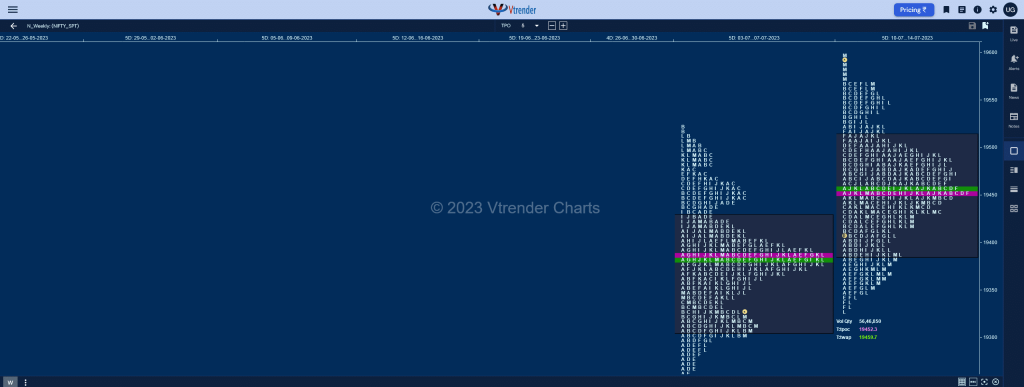
Nifty Spot Weekly Profile (10th to 14th Jul 2023) 19564 [ 19595 / 19327 ] Previous week’s report ended with this ‘The weekly profile which started with a hat-trick of Normal Days and ended with couple of Normal Variation ones on both the sides resembles a balance with completely higher Value at 19307-19387-19429 which started […]
Order Flow charts dated 14th July 2023

Many traders are looking for information on how to use market conditions to find good trades. Order Flow is best understood as a way to see existing bias in the markets. Order Flow helps us understand who is in control of the market and who is ‘upside down’ and likely to make exits from that […]
Market Profile Analysis & Weekly Settlement Report dated 13th July 2023
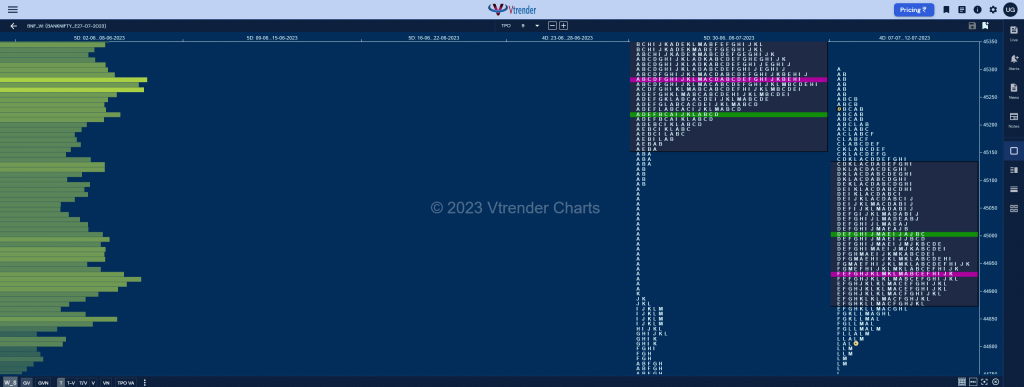
Nifty July F: 19474 [ 19614 / 19452 ] NF opened higher and confirmed a Drive Up moving away from the 2-day composite POC of 19516 with an initiative buying tail from 19567 to 19508 as it went on to hit new ATH of 19614 in the IB (Initial Balance) but could not extend any further […]
Order Flow charts dated 13th July 2023

Many traders are used to viewing volume as a histogram beneath a price chart. But the Order Flow approach shows the amount of volume traded during each price bar, and also it breaks this volume down into the Volume generated by the Buyers and the Volume generated by the sellers again at every row of […]
Market Profile Analysis dated 12th July 2023
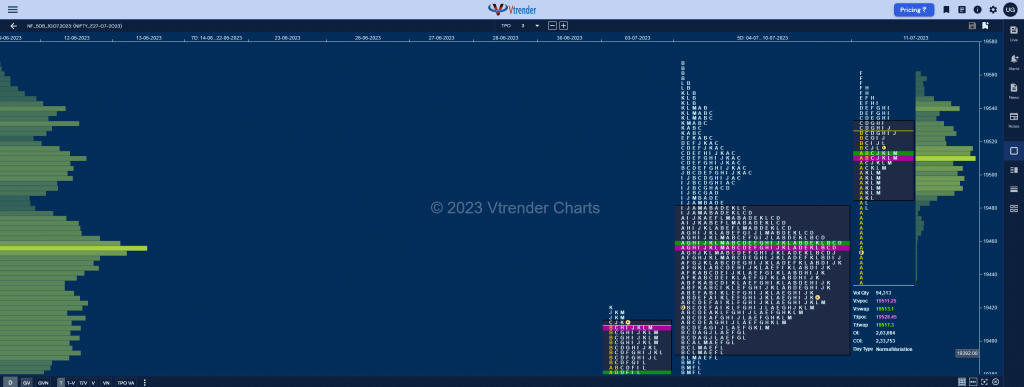
Nifty July F: 19461 [ 19544 / 19450 ] NF opened higher making a look up above previous Value but could not sustain after making a high of 19544 duly completing the 80% Rule as it went on to make a low of 19488 in the A period itself and had a silent B TPO forming […]
Order Flow charts dated 12th July 2023
When we think about how to measure volume in the market one of the keys is Order Flow. It plays a role by telling us what the other traders have done in the market and are currently doing and this provides valuable clues and potential opportunities to trade. An Order Flow trader can actually see […]
Market Profile Analysis dated 11th July 2023
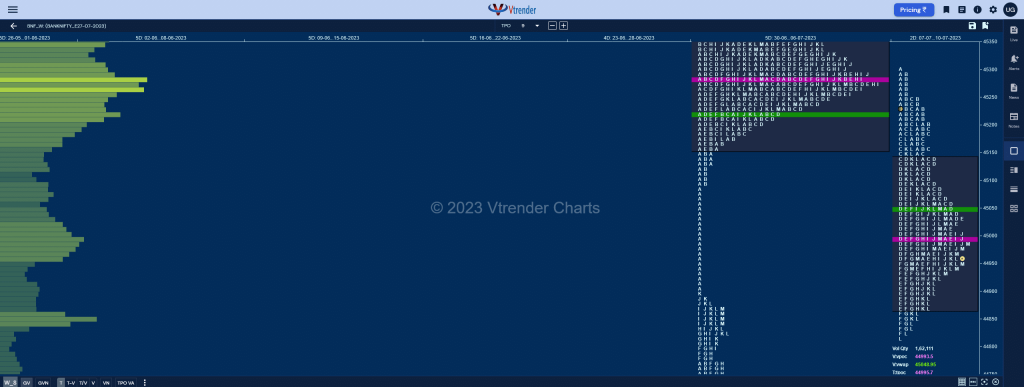
Nifty July F: 19500 [ 19562 / 19436 ] NF made a gap up open moving away from yPOC of 19424 as it scaled above yIBH of 19462 confirming a multi-day FA (Failed Auction) at the start and promptly completed the 1 ATR objective of 19505 in the A period itself confirming an Open Test Drive […]
Order Flow charts dated 11th July 2023
The key to using Order Flow trading is to determine market depth. This describes the places where Market participants have taken positions or the zone they have transacted. The Order Flow is like a list of trades and helps to know how other traders are placed in the market. Vtrender helps you to stay on […]
Market Profile Analysis dated 10th July 2023
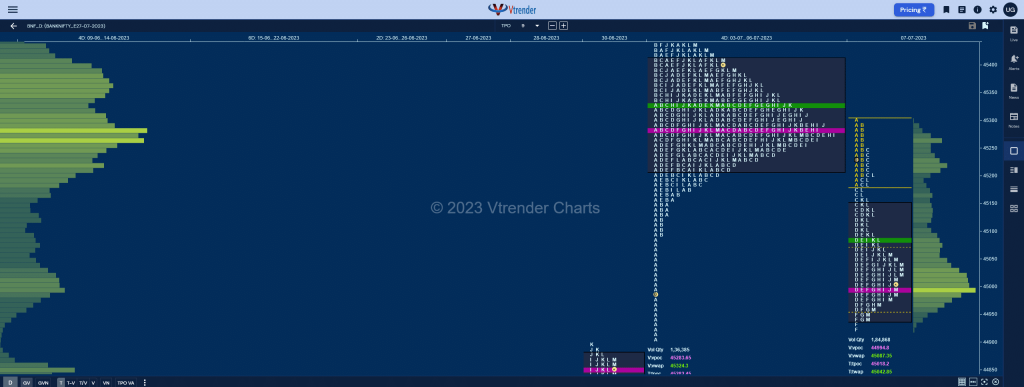
Nifty July F: 19409 [ 19481 / 19375 ] NF made an OAIR start rejecting the spike close of previous session as it remained above 19401 and went on to probe higher in the IB (Initial Balance) tagging that prominent 4-day POC of 19456 while making a high of 19462 after which it made a good […]
