Order Flow charts dated 10th July 2023
Trading Order Flow allows a trader to see the specific price where a trade has hit the market, along with the volume of that trade. This information is extremely valuable and allows a trader to generate substantial revenue by using this information to trade. The way we see it is that Order Flow trading is […]
Market Profile Analysis dated 07th July 2023
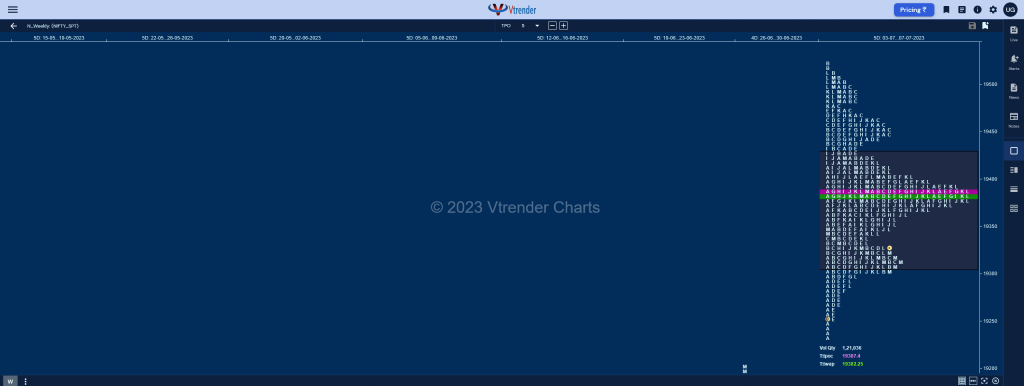
Nifty July F: 19398 [ 19567 / 19380 ] NF rejected previous day’s spike close with a lower open at 19485 and a test of the 2-day composite VAH of 19474 as it made a low of 19470 getting swiftly rejected triggering a fresh upmove right back into the spike zone of 19523 to 19555 even […]
Weekly Charts (03rd to 07th Jul 2023) and Market Profile Analysis
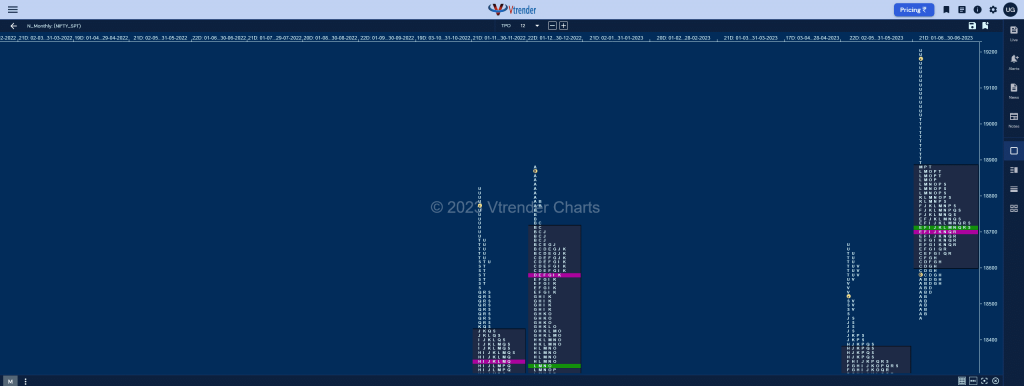
Nifty Spot Weekly Profile (03rd to 07th Jul 2023) 19331 [ 19523 / 19234 ] Previous week’s report ended with this ‘The weekly profile is an elongated Trending One to the upside of 555 points with a prominent POC right near the bottom at 18671 and daily extension handles at 18761, 18829 & 19011 along […]
Order Flow charts dated 07th July 2023
Timing is the key to successfully trade the markets in the shorter time frame. Order Flow is one of the most effective methods to time your trades by seeing exactly what the other traders are trading in the market and positioning your bias accordingly. Order Flow is the most transparent way to trade and takes […]
Market Profile Analysis & Weekly Settlement Report dated 06th July 2023
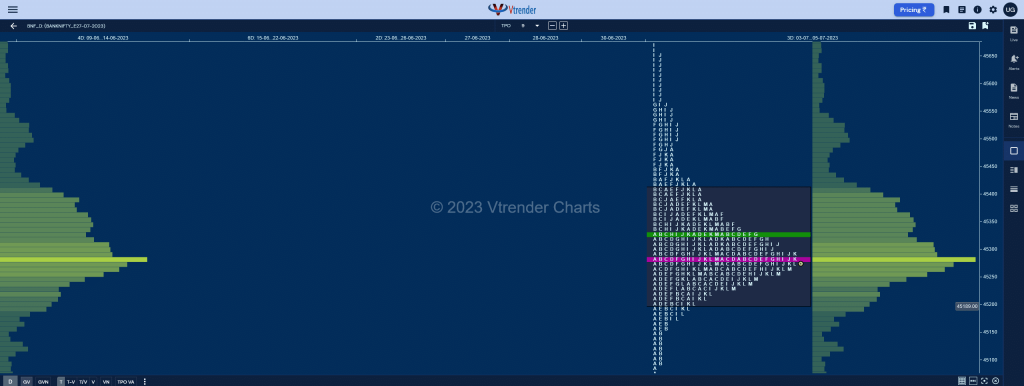
Nifty July F: 19536 [ 19555 / 19435 ] NF opened with a probe lower as it tested yVAL of 19435 and got swiftly rejected leaving an initiative buying tail till 19458 after which it signalled a move away from the 2-day balance with an extension handle at 19480 and higher highs till the E period […]
Order Flow charts dated 06th July 2023
A good trader is a one who can make money consistently over a longer period of time. But how to become one such trader, who can make money in any type of market condition? A good trader keeps a close watch on the current information of the market and assesses it for change against previous […]
Market Profile Analysis dated 05th July 2023
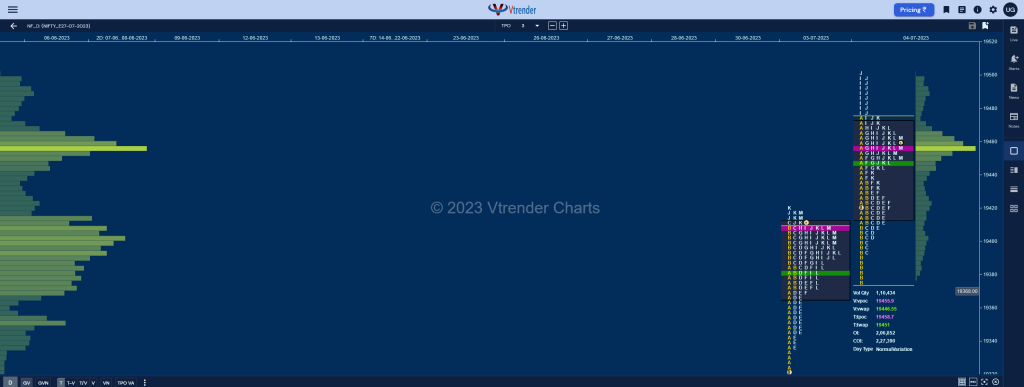
Nifty July F: 19466 [ 19486 / 19416 ] NF opened with a freak tick at 19401-19400 but actual volumes were visible only from 19422 as it made an attempt to probe higher even scaling above previous Value in the A period where it made a high of 19484 but could not sustain and began to […]
Order Flow charts dated 05th July 2023
Many traders are used to viewing volume as a histogram beneath a price chart. This approach shows the amount of volume traded below the price Bar. The Order Flow approach is to see the Volume traded inside or within the price bar, an important distinction. Order Flow trading is thinking about what order market participants […]
Market Profile Analysis dated 04th July 2023
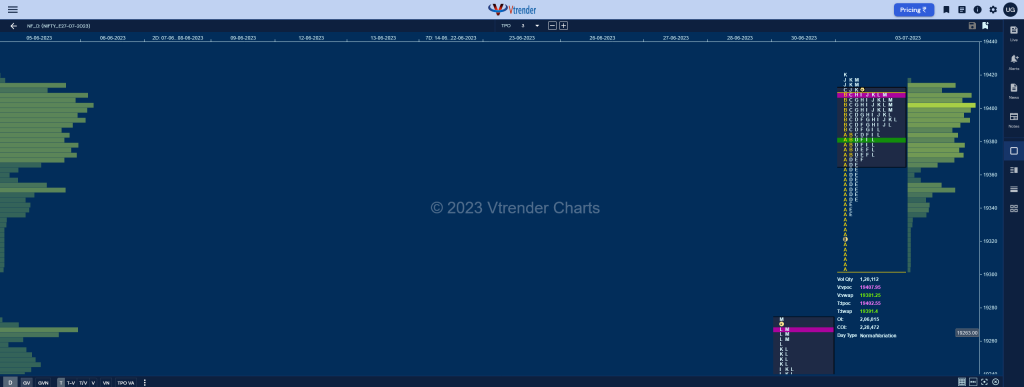
Nifty July F: 19458 [ 19500 / 19376 ] NF opened above PDH and probed higher to 19474 in the opening minutes but could not sustain and got back into previous day’s range and almost completed the 80% Rule in the Value Area while making a low of 19376 in the B period taking support just […]
Order Flow charts dated 04th July 2023

Many traders are looking for information on how to use market conditions to find good trades. Order Flow is best understood as a way to see existing bias in the markets. Order Flow helps us understand who is in control of the market and who is ‘upside down’ and likely to make exits from that […]
