Market Profile Analysis dated 13th June 2023
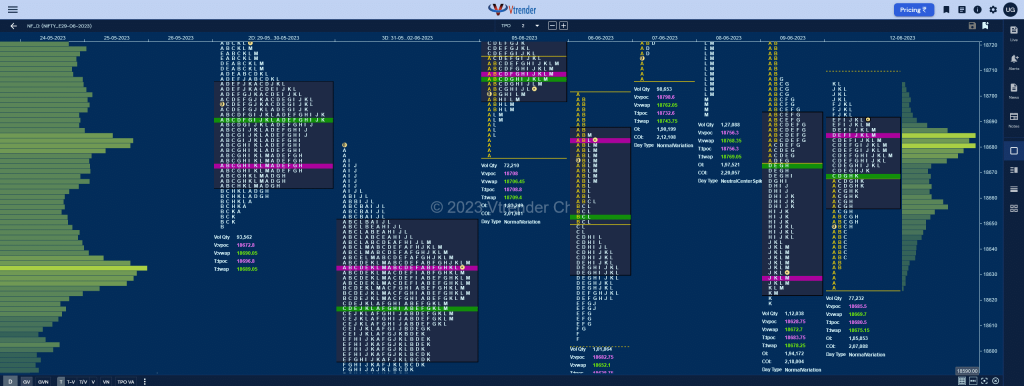
Nifty June F: 18776 [ 18783 / 18721 ] NF made a higher open and remained above the 09th Jun’s IB HVN of 18729 negating 08th’s NeuX extension handle of 18741 and making a look up above that day’s VWAP of 18768 while making a high of 18773 in the B period leaving an initiative buying […]
Order Flow charts dated 13th June 2023
A good trader is a one who can make money consistently over a longer period of time. But how to become one such trader, who can make money in any type of market condition? A good trader keeps a close watch on the current information of the market and assesses it for change against previous […]
Market Profile Analysis dated 12th June 2023
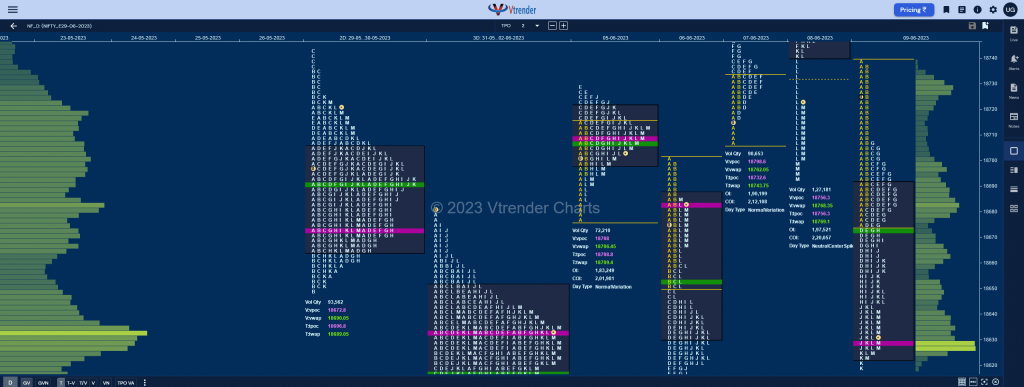
Nifty June F: 18683 [ 18705 / 18624 ] NF made yet another OAIR (Open Auction In Range) start and found some demand coming at yPOC of 18628 as it left a small buying tail in the IB (Initial Balance) but was stalled just below yVWAP of 18672 forming a narrow 43 point range which was […]
Order Flow charts dated 12th June 2023
Many traders are used to viewing volume as a histogram beneath a price chart. This approach shows the amount of volume traded below the price Bar. The Order Flow approach is to see the Volume traded inside or within the price bar, an important distinction. Order Flow trading is thinking about what order market participants […]
Market Profile Analysis dated 09th June 2023
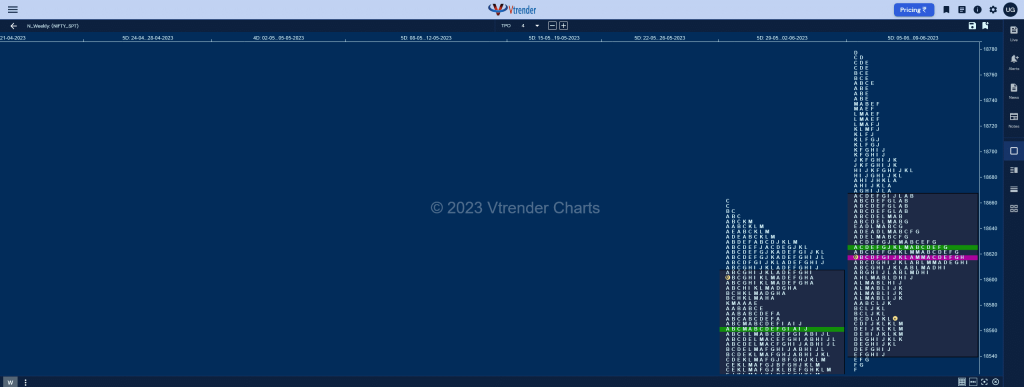
Nifty June F: 18631 [ 18740 / 18618 ] NF made an OAIR (Open Aution In Range) start stalling just below the Neutral Extreme (NeuX) zone high of 18741 and probing below PDL of 18693 as it tagged the 06th Jun’s VPOC of 18682 in the A period but did not find any fresh supply resulting […]
Weekly Charts (05th to 09th Jun 2023) and Market Profile Analysis
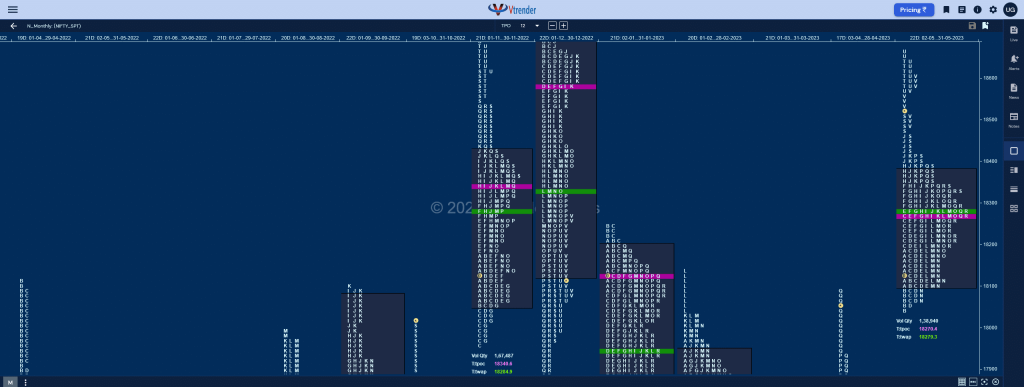
Nifty Spot Weekly Profile (05th to 09th Jun 2023) 18563 [ 18778 / 18531 ] Previous week’s report ended with this ‘The weekly profile remained in a narrow range of just 198 points forming a Neutral Centre set up with completely higher Value at 18479-18562-18604 which in turn consists of a 2-day balance with a […]
Order Flow charts dated 09th June 2023
Many traders are looking for information on how to use market conditions to find good trades. Order Flow is best understood as a way to see existing bias in the markets. Order Flow helps us understand who is in control of the market and who is ‘upside down’ and likely to make exits from that […]
Market Profile Analysis & Weekly Settlement Report dated 08th June 2023
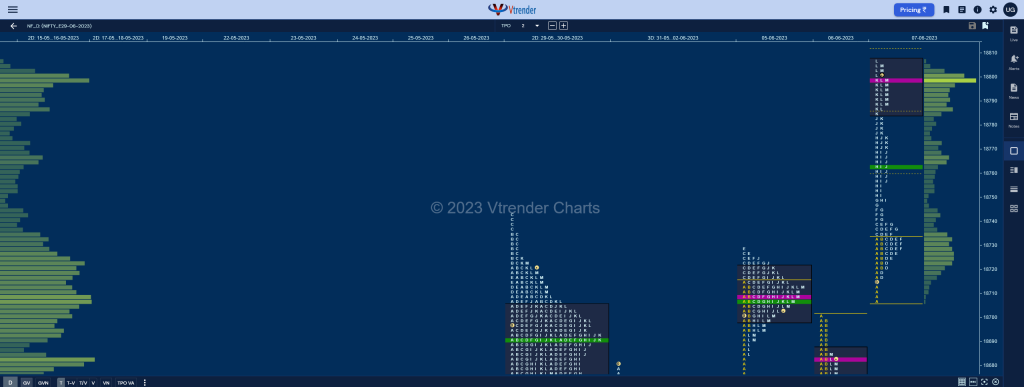
Nifty June F: 18710 [ 18842 / 18693 ] NF took support at previous day’s higher extension handle of 18782 at open and continued the imbalance to the upside leaving an A period buying tail from 18807 to 18780 as it went on to complete the 2 ATR objective of 18828 from the FA of 18556 […]
Order Flow charts dated 08th June 2023
Many traders are used to viewing volume as a histogram beneath a price chart. But the Order Flow approach shows the amount of volume traded during each price bar, and also it breaks this volume down into the Volume generated by the Buyers and the Volume generated by the sellers again at every row of […]
Market Profile Analysis dated 07th June 2023
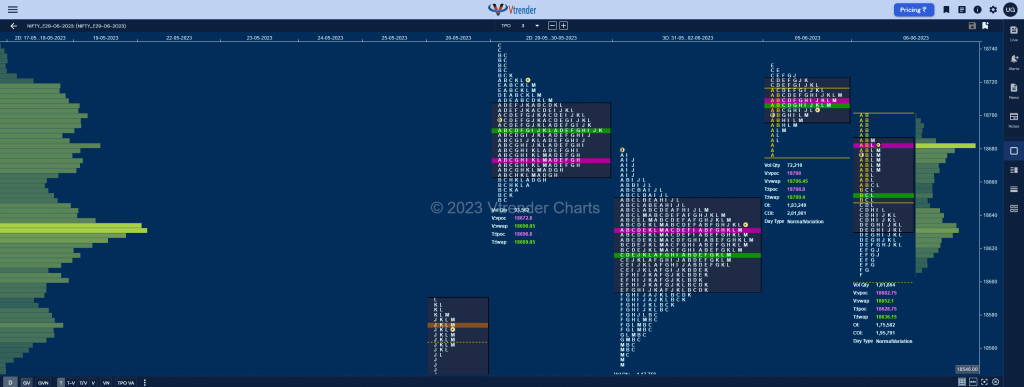
Nifty June F: 18798 [ 18807 / 18706 ] NF continued the closing imbalance of previous session with a higher open and a probe above 05th Jun’s prominent TPO POC of 18713 leaving an initiative buying tail in the IB in an ultra narrow range of just 28 points after which it made a C side […]
