Order Flow charts dated 07th June 2023
When we think about how to measure volume in the market one of the keys is Order Flow. It plays a role by telling us what the other traders have done in the market and are currently doing and this provides valuable clues and potential opportunities to trade. An Order Flow trader can actually see […]
Market Profile Analysis dated 06th June 2023
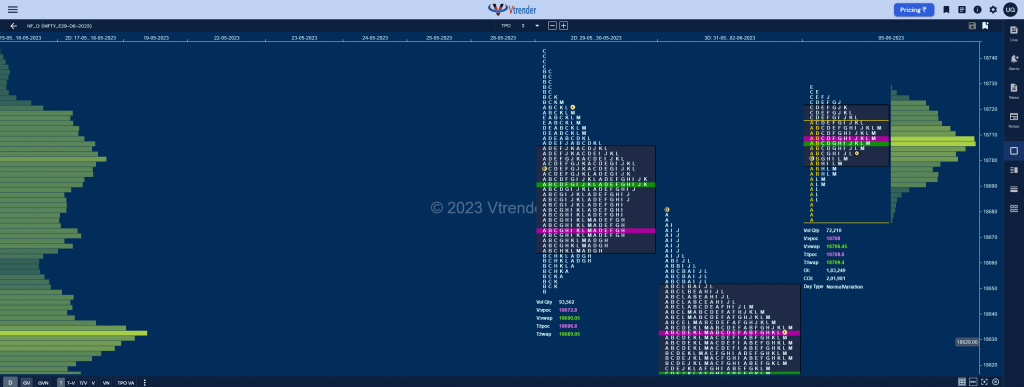
Nifty June F: 18673 [ 18701 / 18605 ] NF started with a probe below PDL as it hit 18659 but found some demand coming back triggering a bounce back to 18701 in the A period itself where the sellers struck back resulting in an extension handle at 18659 & a trending move lower till the […]
Order Flow charts dated 06th June 2023
The key to using Order Flow trading is to determine market depth. This describes the places where Market participants have taken positions or the zone they have transacted. The Order Flow is like a list of trades and helps to know how other traders are placed in the market. Vtrender helps you to stay on […]
Market Profile Analysis dated 05th June 2023
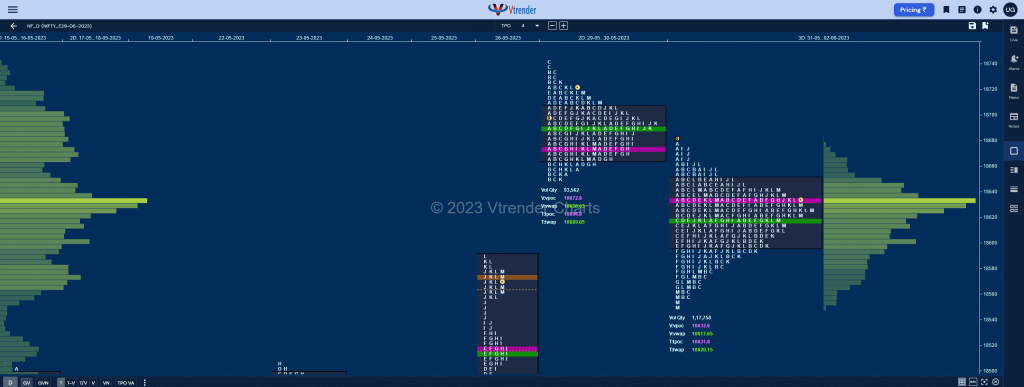
Nifty June F: 18696 [ 18729 / 18676 ] NF opened higher moving away from the 3-day balance it was forming but settled down into an OAOR (Open Auction Out of Range) forming an ultra narrow IB range of just 38 points in which it left an A period buying tail and made couple of REs […]
Order Flow charts dated 05th June 2023
Trading Order Flow allows a trader to see the specific price where a trade has hit the market, along with the volume of that trade. This information is extremely valuable and allows a trader to generate substantial revenue by using this information to trade. The way we see it is that Order Flow trading is […]
Market Profile Analysis dated 02nd June 2023
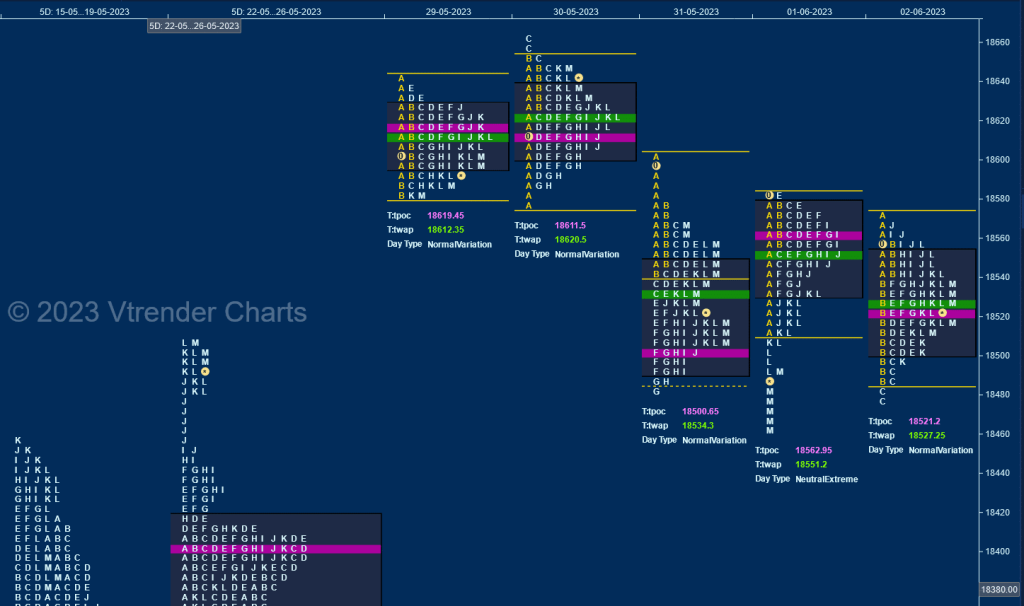
Nifty June F: 18636 [ 18675 / 18556 ] NF rejected previous session’s spike close by opening higher and went on to test the selling tail as it made a high of 18657 and this inability to scale above PDH got some selling in the B period where it left an extension handle at 18610 and […]
Weekly Charts (29th May to 02nd Jun 2023) and Market Profile Analysis
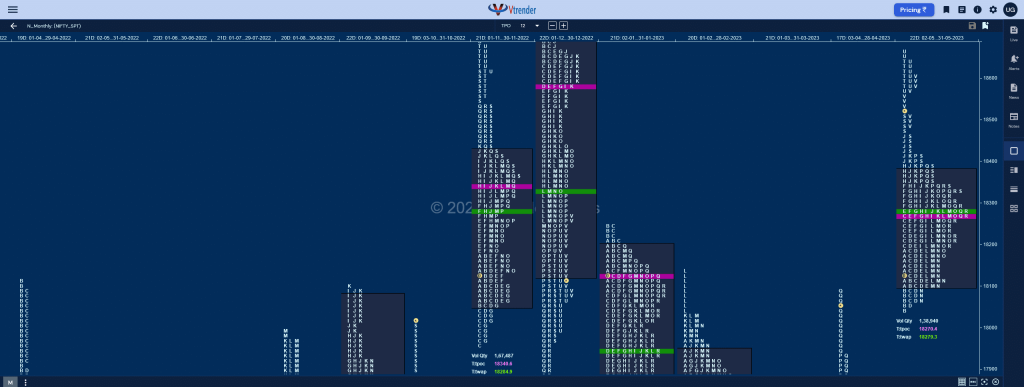
Nifty Spot Weekly Profile (29th May to 02nd Jun 2023) 18534 [ 18662 / 18464 ] Previous week’s profile had an initiative buying tail from 18202 to 18178 forming Normal Variation to the upside as it first built a prominent TPO POC at 18294 & completed the weekly 2 IB objective closing in a spike […]
Monthly charts (May 2023) and Market Profile Analysis
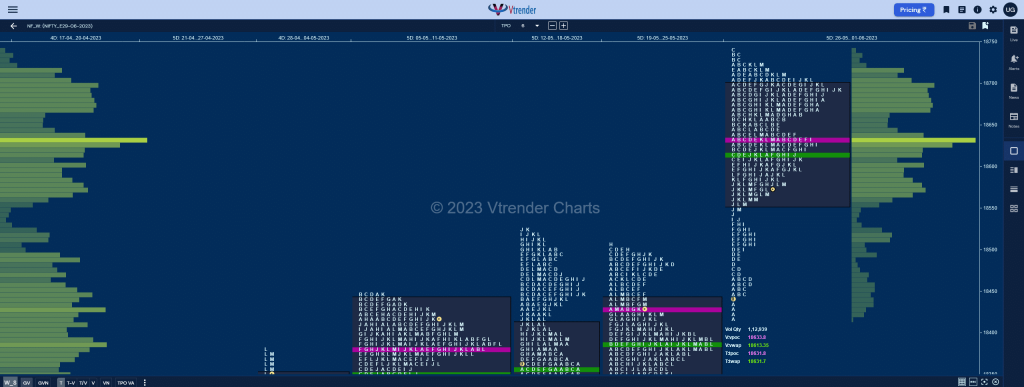
Nifty Spot – 18534 [ 18662 / 18042 ] Monthly Profile (May 2023) Previous month’s report ended with this ‘The Monthly Profile is a Normal Variation One to the upside with completely higher Value at 17580-17632-17799 and has left an extension handle at 17842 along with a spike from 17931 to 18089 which will be support zone on […]
Order Flow charts dated 02nd June 2023
Timing is the key to successfully trade the markets in the shorter time frame. Order Flow is one of the most effective methods to time your trades by seeing exactly what the other traders are trading in the market and positioning your bias accordingly. Order Flow is the most transparent way to trade and takes […]
Market Profile Analysis & Weekly Settlement Report dated 01st June 2023
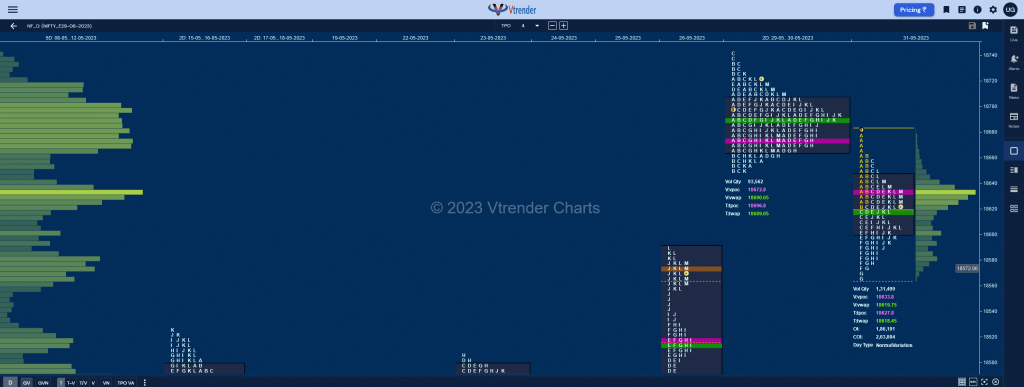
Nifty June F: 18570 [ 18659 / 18550 ] NF made an OAIR start & remained in previous day’s range & value for most part of the day forming a narrow 69 point range IB between 18590 to 18659 and completed a nice 2-day composite Gaussian Curve till the K TPO before making a move away […]
