Market Profile Analysis dated 19th Apr 2023
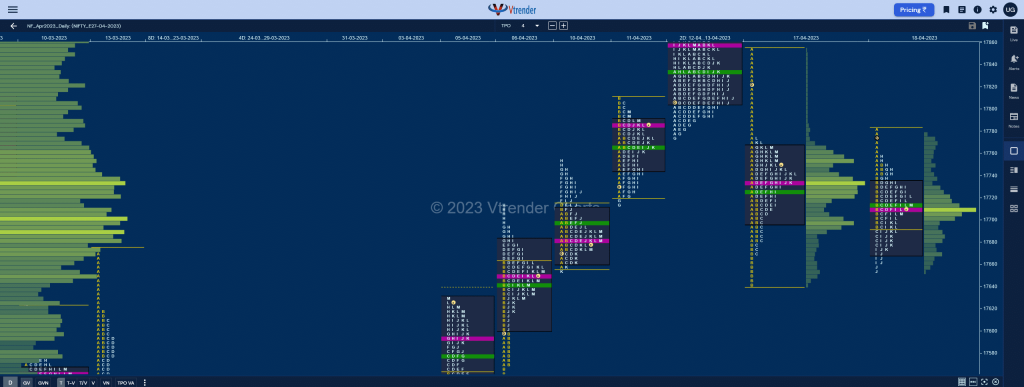
Nifty Apr F: 17645 [ 17710 / 17622 ] NF made an OAIR start and remained below the 2-day composite POC of 17710 forming an ultra narrow 55 point range IB and filled up the lower half of the composite till the H period before making an attempt to break lower in the I TPO as […]
Order Flow charts dated 19th April 2023
Many traders are looking for information on how to use market conditions to find good trades. Order Flow is best understood as a way to see existing bias in the markets. Order Flow helps us understand who is in control of the market and who is ‘upside down’ and likely to make exits from that […]
Market Profile Analysis dated 18th Apr 2023
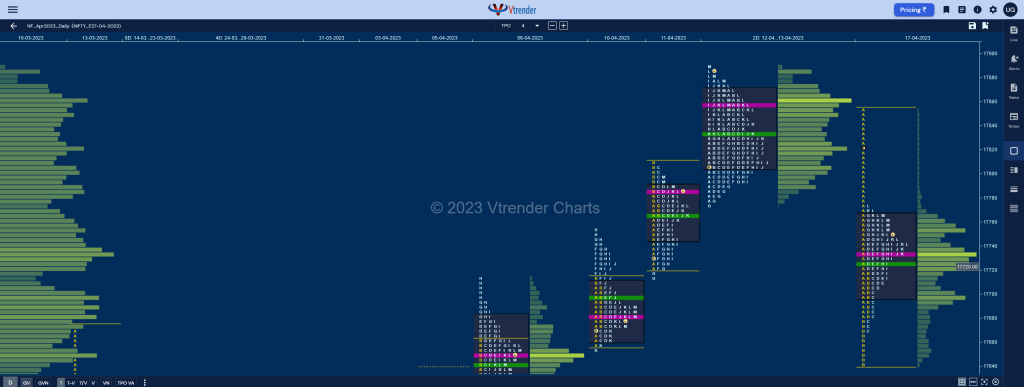
Nifty Apr F: 17712 [ 17780 / 17652 ] NF made an attempt to get into previous profile’s A period selling tail from 17773 to 17833 but could only manage to tag 17780 getting rejected back into previous Value triggering the 80% Rule which it promptly completed in the IB (Initial Balance) while making a low […]
Order Flow charts dated 18th April 2023
Many traders are used to viewing volume as a histogram beneath a price chart. But the Order Flow approach shows the amount of volume traded during each price bar, and also it breaks this volume down into the Volume generated by the Buyers and the Volume generated by the sellers again at every row of […]
Market Profile Analysis dated 17th Apr 2023
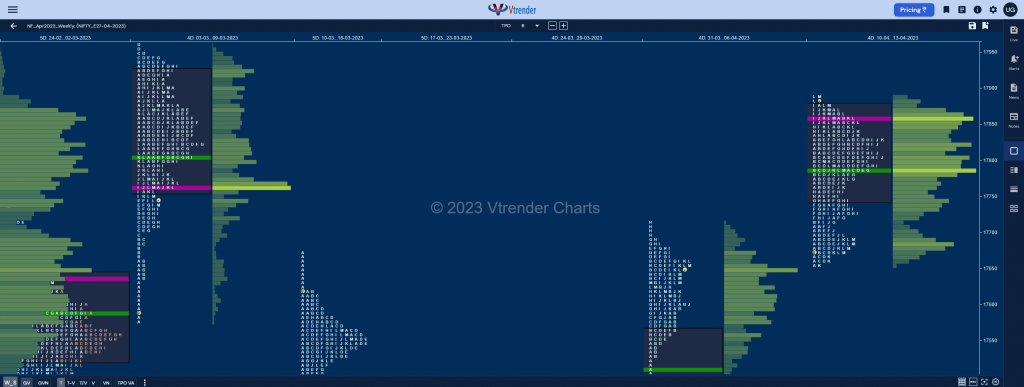
Nifty Apr F: 17760 [ 17833 / 17640 ] NF rejected the NeuX (Neutral Extreme) close of previous session by not only opening lower below yVWAP of 17837 but even broke the weekly VWAP of 17786 giving an initiative move away from the 2-day overlapping Value as it went on to tag the 10th Apr VPOC […]
Order Flow charts dated 17th April 2023
When we think about how to measure volume in the market one of the keys is Order Flow. It plays a role by telling us what the other traders have done in the market and are currently doing and this provides valuable clues and potential opportunities to trade. An Order Flow trader can actually see […]
Market Profile Analysis & Weekly Settlement Report dated 13th Apr 2023
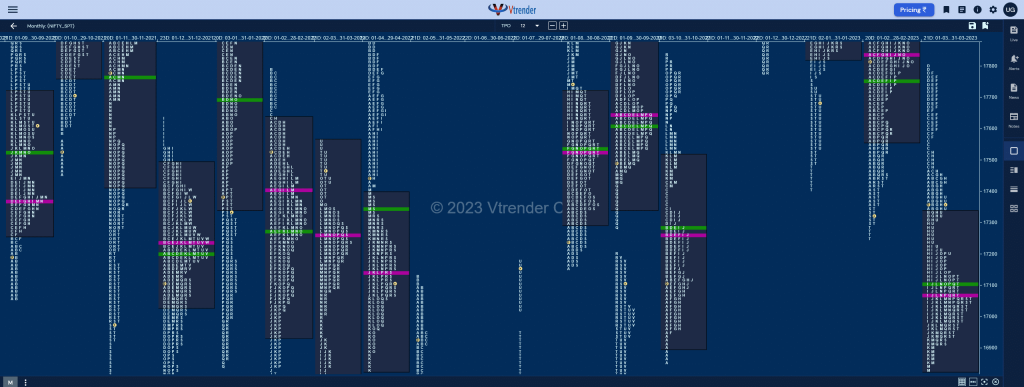
Nifty Apr F: 17879 [ 17890 / 17775 ] NF made an OAIR (Open Auction In Range) start near the yPOC of 17862 & made an attempt to probe higher in the A period but could only manage to hit 17878 failing to get new demand at previous highs as it formed yet another very narrow […]
Order Flow charts dated 13th April 2023
The key to using Order Flow trading is to determine market depth. This describes the places where Market participants have taken positions or the zone they have transacted. The Order Flow is like a list of trades and helps to know how other traders are placed in the market. Vtrender helps you to stay on […]
Market Profile Analysis dated 12th Apr 2023
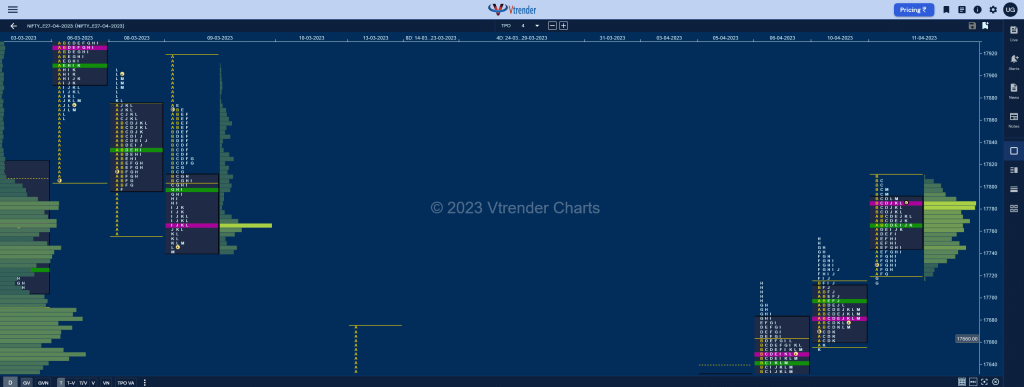
Nifty Apr F: 17858 [ 17879 / 17778 ] NF for the second consecutive day confirmed a multi-day FA (Failed Auction) this time at 17715 as it scaled above 17809 and completed the 1 ATR objective of 17828 from the earlier FA of 17653 in the A period forming a very narrow 56 point range IB […]
Order Flow charts dated 12th April 2023
Trading Order Flow allows a trader to see the specific price where a trade has hit the market, along with the volume of that trade. This information is extremely valuable and allows a trader to generate substantial revenue by using this information to trade. The way we see it is that Order Flow trading is […]
