Order Flow charts dated 9th Mar 2020

Many traders are used to viewing volume as a histogram beneath a price chart. But the Order Flow approach shows the amount of volume traded during each price bar, and also it breaks this volume down into the Volume generated by the Buyers and the Volume generated by the sellers again at every row of […]
Order Flow charts dated 9th Mar 2020 (5 mins)

Order Flow can show how a collection of market participates has acted in the past and this helps to create profit by knowing if these traders are profitable or caught upside down. NF BNF
Weekly charts (02nd to 06th Mar 2020) and Market Profile Analysis
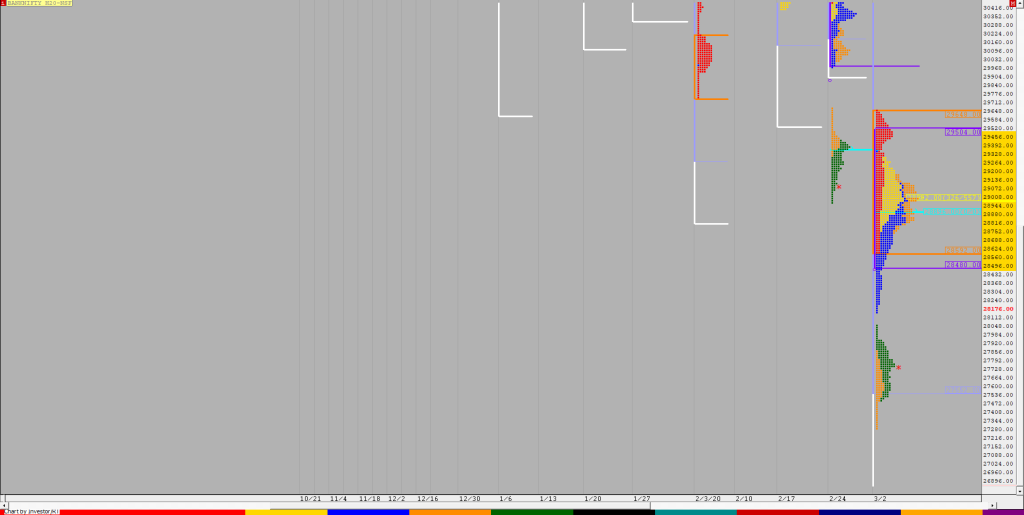
Nifty Spot Weekly Profile (02nd to 06th Mar 2020) Spot Weekly – 10989 [ 11433/ 10827 ] Previous week’s profile (24th to 28th Feb) was a trending one to the downside with an initiative tail from 11981 to 12071 giving a huge range of 838 points with each day forming lower Value than the previous […]
Monthly (February 2020) charts and Market Profile analysis
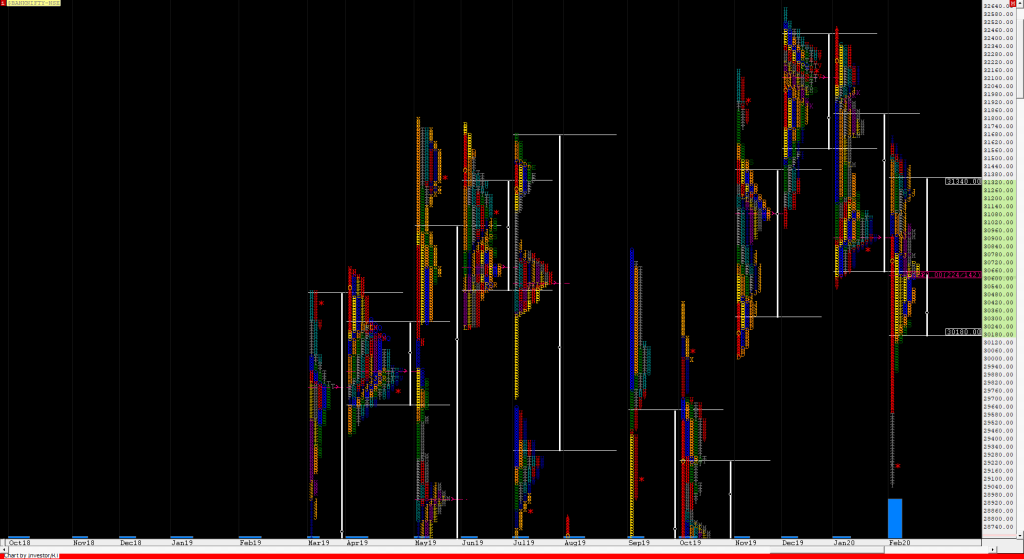
Nifty Spot – 11201 [ 12247 / 11175 ] Monthly Profile (February 2020) Previous month’s report ended with this ‘The monthly profile is a well balanced one with the Value similar to that of previous month but the excess at top & close around the lows has set up the coming month for a big move […]
Order Flow charts dated 6th Mar 2020

When we think about how to measure volume in the market one of the keys is Order Flow. It plays a role by telling us what the other traders have done in the market and are currently doing and this provides valuable clues and potential opportunities to trade. An Order Flow trader can actually see […]
Order Flow charts dated 6th Mar 2020 (5 mins)

Volume Profile and Order Flow are very good tools to assist you in trading. You can also use it along with your existing setup. NF BNF
Market Profile Analysis dated 5th Mar 2020
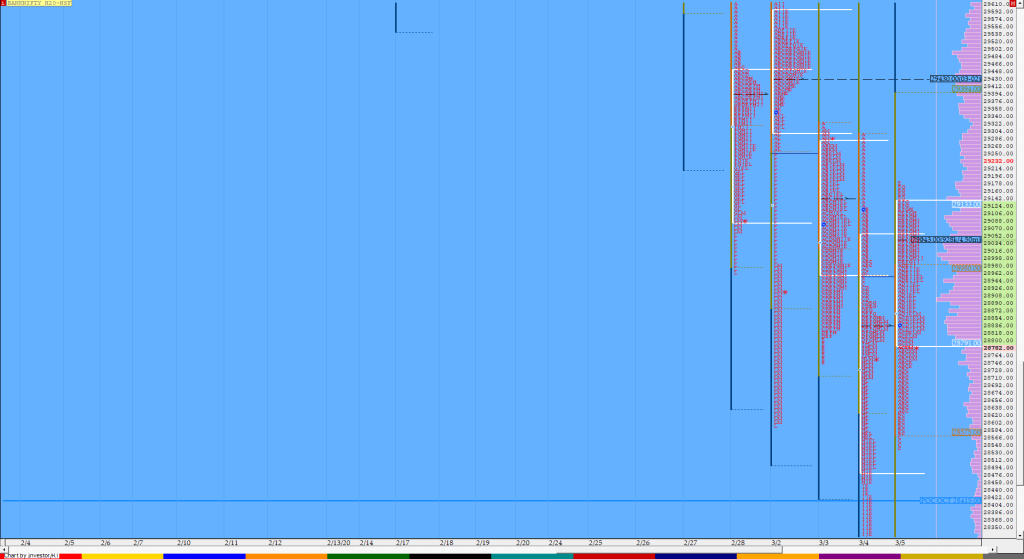
Nifty Mar F: 11255 [ 11382 / 11230 ] HVNs – (11105) / (11145) / 11165-175 / (11250) / 11270-290 / (11340-360) / 11580 NF opened with a gap up of almost 50 points and probed higher but once again got rejected from that 11321 level as it made a high of 11323 in the […]
Order Flow charts dated 5th Mar 2020

Timing is the key to successfully trade the markets in the shorter time frame. Order Flow is one of the most effective methods to time your trades by seeing exactly what the other traders are trading in the market and positioning your bias accordingly. Order Flow is the most transparent way to trade and takes […]
Order Flow charts dated 5th Mar 2020 (5 mins)

An Order Flow trader can actually see exactly what is happening in the market as it happens. Once you are able to understand what is happening in the present, you are able to make far better decisions about what might happen in the future. Order Flow provides traders with vision into market activity. NF BNF
Market Profile Analysis dated 4th Mar 2020
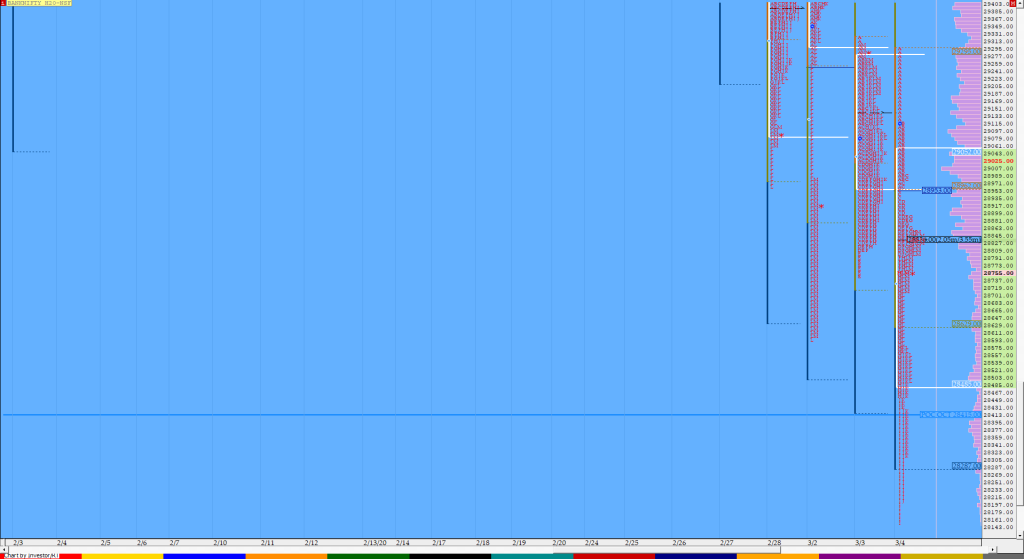
Nifty Mar F: 11247 [ 11338 / 11061 ] HVNs – (11105) / (11145) / 11165-175 / (11230) / 11275-290 / (11340) / 11580 / 11631 / 11734 / 11850 / 11945 NF seemed to have started with an ORR (Open Rejection Reverse) today as it scaled above PDH (Previous Day High) at open but […]
