Desi MO (McClellans Oscillator For NSE) – 9th JAN 2020
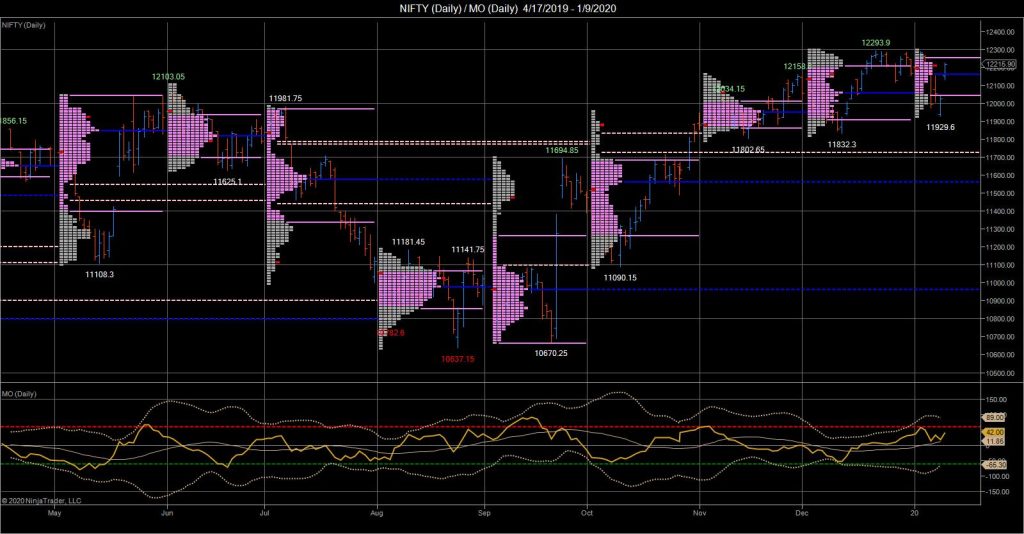
MO at 42
Desi MO (McClellans Oscillator For NSE) – 8th JAN 2020
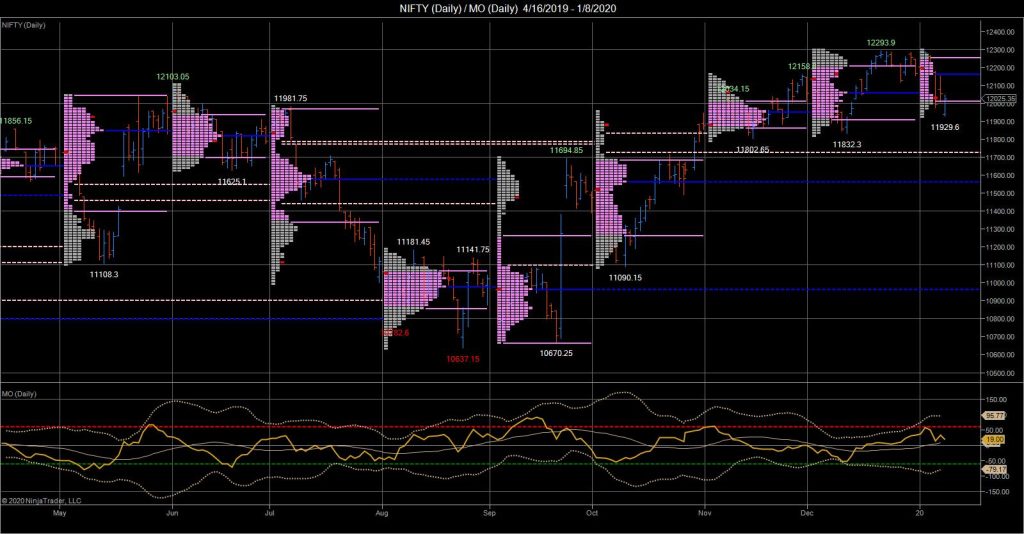
MO at 19
Desi MO (McClellans Oscillator For NSE) – 7th JAN 2020
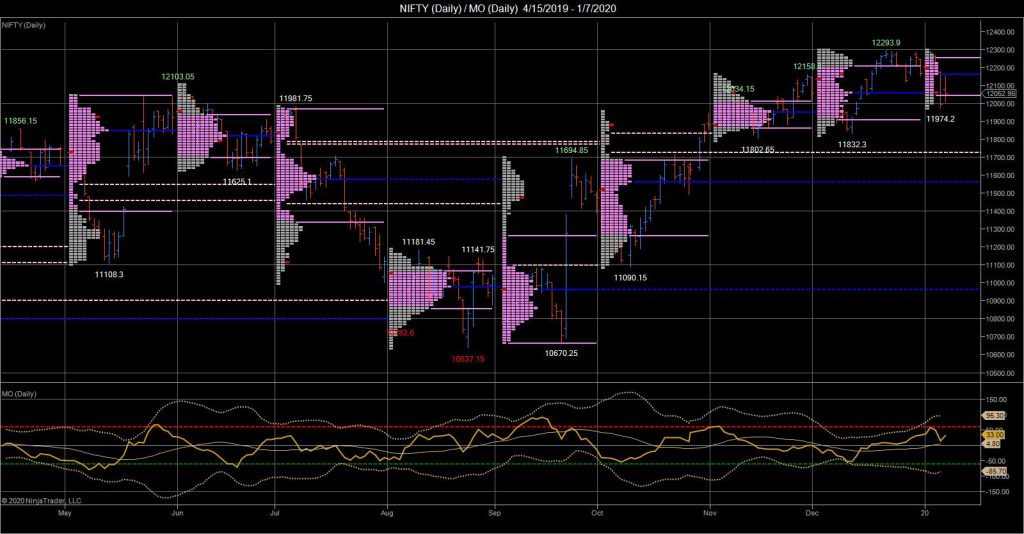
MO at 33
Desi MO (McClellans Oscillator For NSE) – 6th JAN 2020
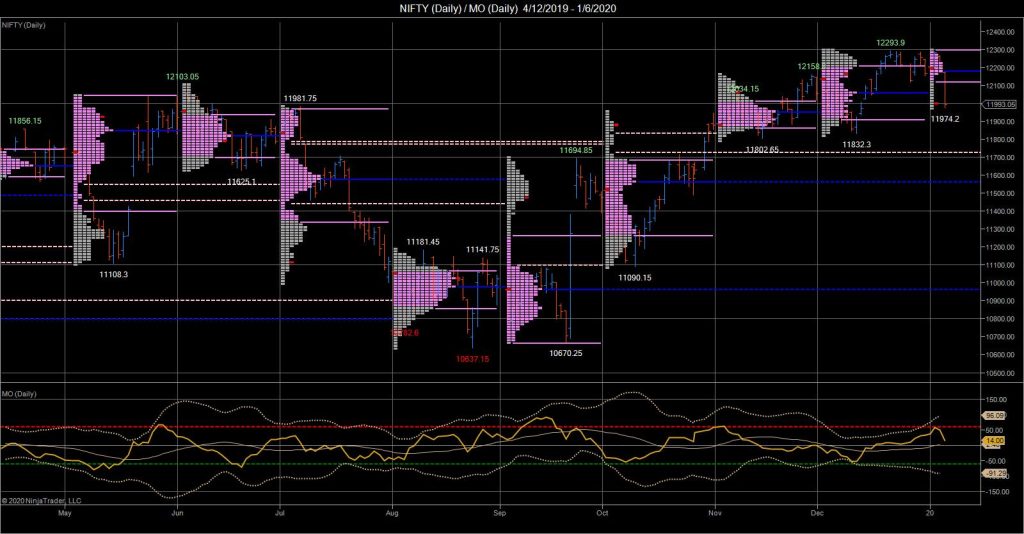
MO at 14
Desi MO (McClellans Oscillator For NSE) – 3rd JAN 2020
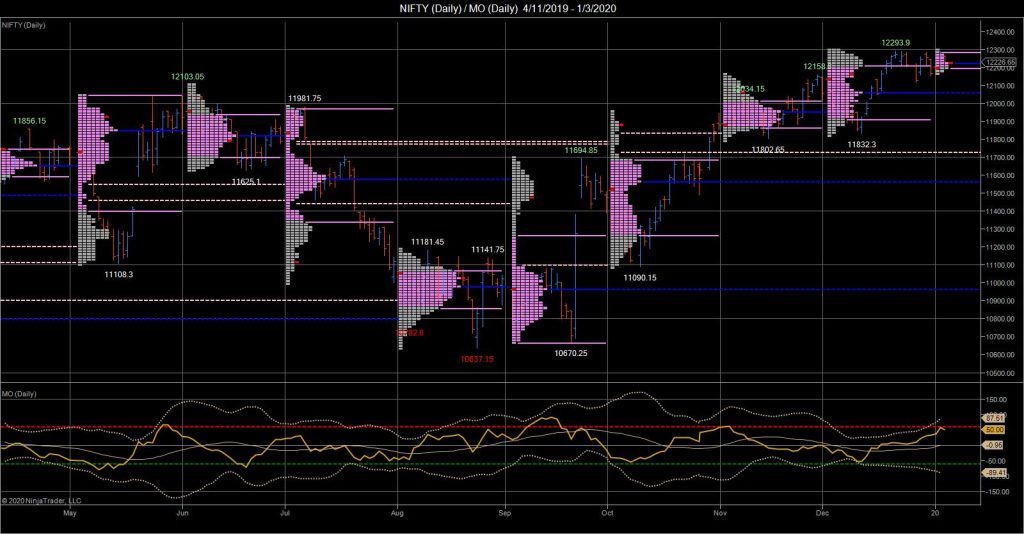
MO at 50
Desi MO (McClellans Oscillator For NSE) – 2nd JAN 2020
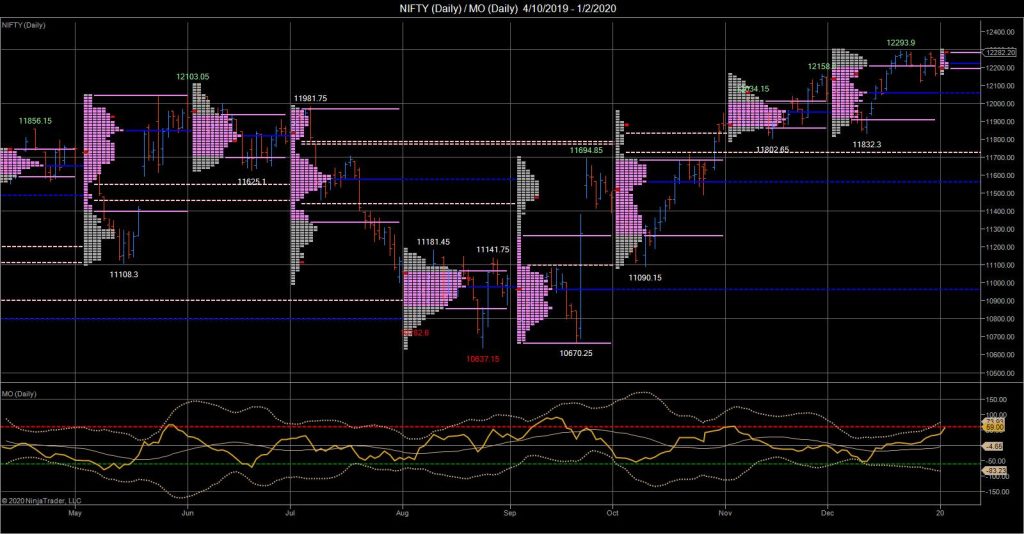
MO at 59 Declining volume dip below 10%
Desi MO (McClellans Oscillator For NSE) – 1st JAN 2020
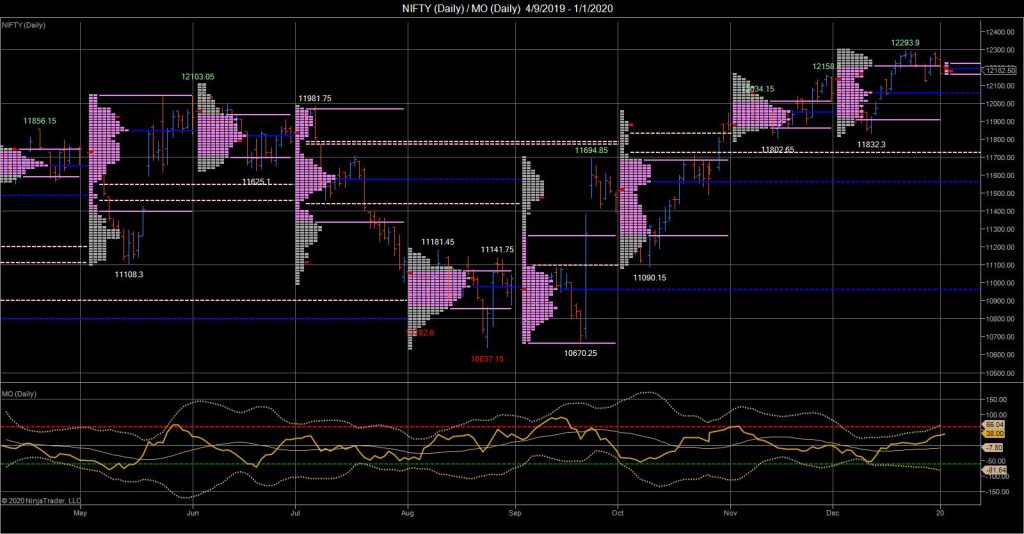
MO at 38
What is exactly the Orderflow?
What is this term called Orderflow? and how does knowing it help my trading? Orderflow simply means reading the demand and supply side of the market. Because it is read live and based on current actual traded volumes of the market, we have what are called Orderflow charts. Orderflow replicates the transactions taking at the […]
Market Profile Charts dated 19th Oct
Through a Market Profile chart , a trader can actually see exactly what is happening in the market as it happens. Once you are able to understand what is happening in the present, you are able to make far better decisions about what might happen in the future. Market Profile provides traders with vision into […]
Order Flow charts dated 19th Oct (5 min)
Timing is the key to successfully trade the markets in the shorter time frame. Order Flow is one of the most effective methods to time your trades by seeing exactly what the other traders are trading in the market and positioning your bias accordingly. Order Flow is the most transparent way to trade and […]
