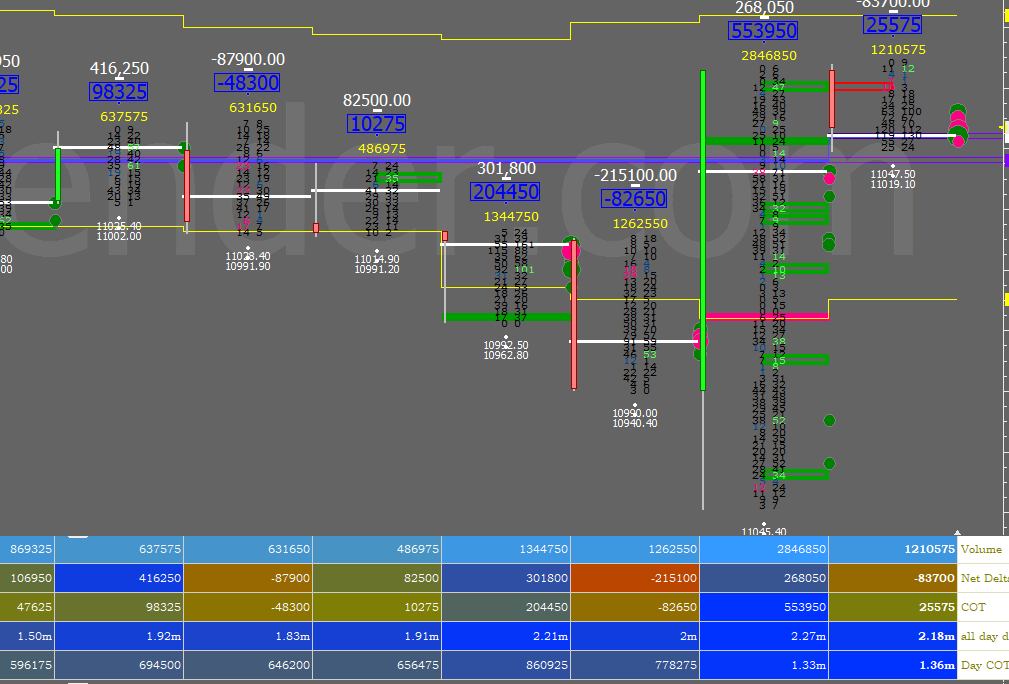
Order Flow charts dated 28th Aug

Many traders are looking for information on how to use market conditions to find good trades. Order Flow is best understood as a way to see existing bias in the markets. Order Flow helps us understand who is in control of the market and who is ‘upside down’ and likely to make exits from that […]
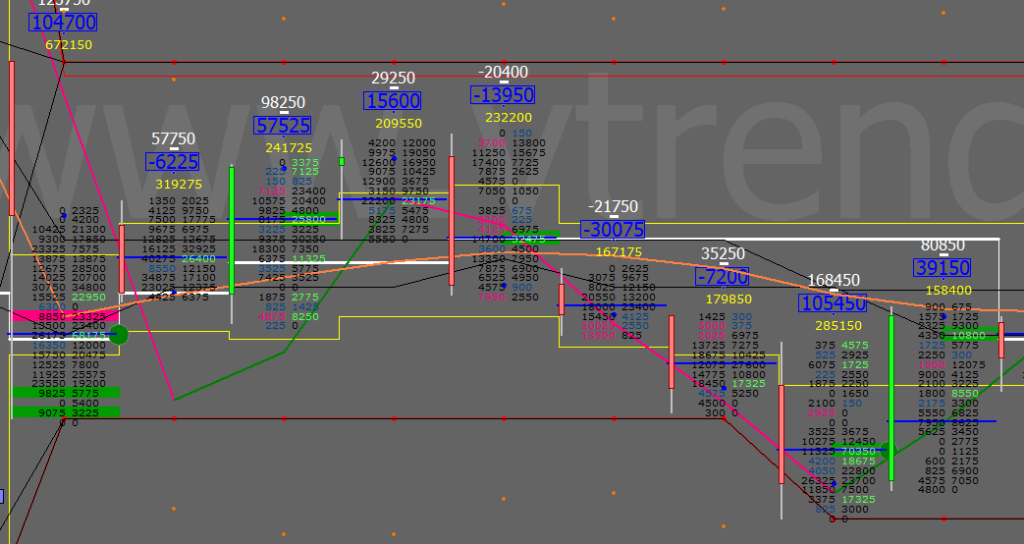
Order Flow charts dated 28th Aug (5 mins)

Many traders are used to viewing volume as a histogram beneath a price chart. But the Order Flow approach shows the amount of volume traded during each price bar, and also it breaks this volume down into the Volume generated by the Buyers and the Volume generated by the sellers again at every row of […]
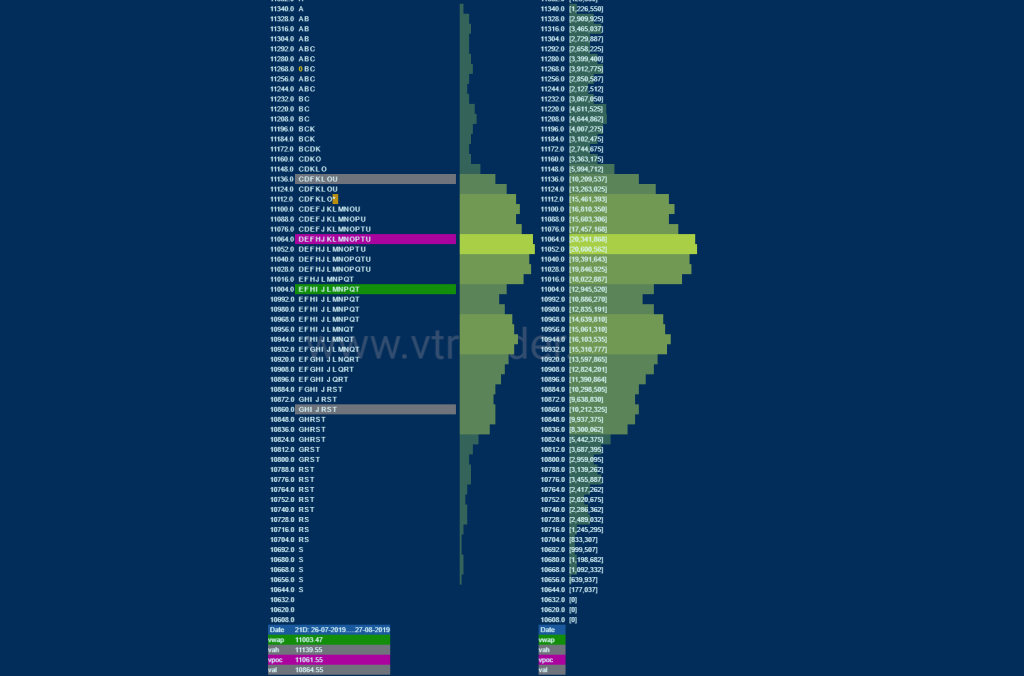
Market Profile Analysis dated 27th August

Nifty Aug F: 11104 [ 11133 / 11034 ] NF had left the biggest day in terms of range (327 points) as well as volumes (213 L) of the August series on Monday (26th Aug) and in Market Profile it always happens that ‘Balance follows Imbalance & vice versa’ so after a hat-trick of big range […]
