Market Profile Analysis dated 22nd September 2020
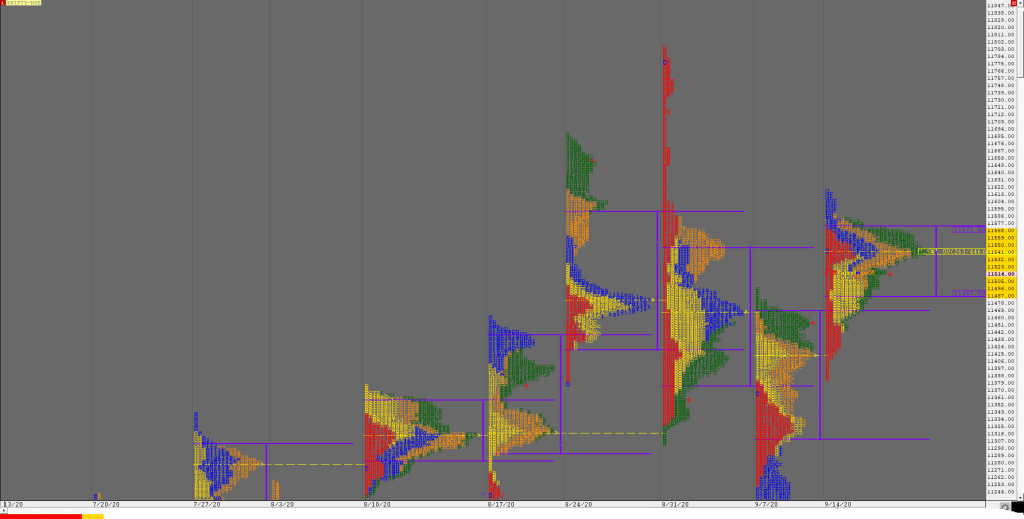
Nifty Sep F: 11162 [ 11292 / 11103 ] NF opened slightly higher but could not get above the Neutral Extreme reference of 11324 as it got stalled at 11292 from where it resumed the imbalance seen since yesterday afternoon and it not only broke below PDL (Previous Day Low) but also took out the […]
Order Flow charts dated 22nd September 2020

Timing is the key to successfully trade the markets in the shorter time frame. Order Flow is one of the most effective methods to time your trades by seeing exactly what the other traders are trading in the market and positioning your bias accordingly. Order Flow is the most transparent way to trade and takes […]
Market Profile Analysis dated 21st September 2020

Nifty Sep F: 11256 [ 11527 / 11225 ] NF made an OAIR (Open Auction In Range) start on low volumes as it remained mostly above previous week’s VAL for the first half of the day but importantly made a C side extension higher where it got rejected from just below the prominent weekly POC […]
Order Flow charts dated 21st September 2020

The key to using Order Flow trading is to determine market depth. This describes the places where Market participants have taken positions or the zone they have transacted. The Order Flow is like a list of trades and helps to know how other traders are placed in the market. Vtrender helps you to stay on […]
Market Profile Analysis dated 18th September 2020

Nifty Sep F: 11515 [ 11599 / 11455 ] Report to be updated.. Click here to view the weekly balance of NF on MPLite The NF Open was a Open Auction In Range (OAIR) The Day type was a Neutral Extreme Day – Down (NeuX) Largest volume was traded at 11517 F Vwap of the session […]
Weekly charts (14th to 18th September 2020) and Market Profile Analysis
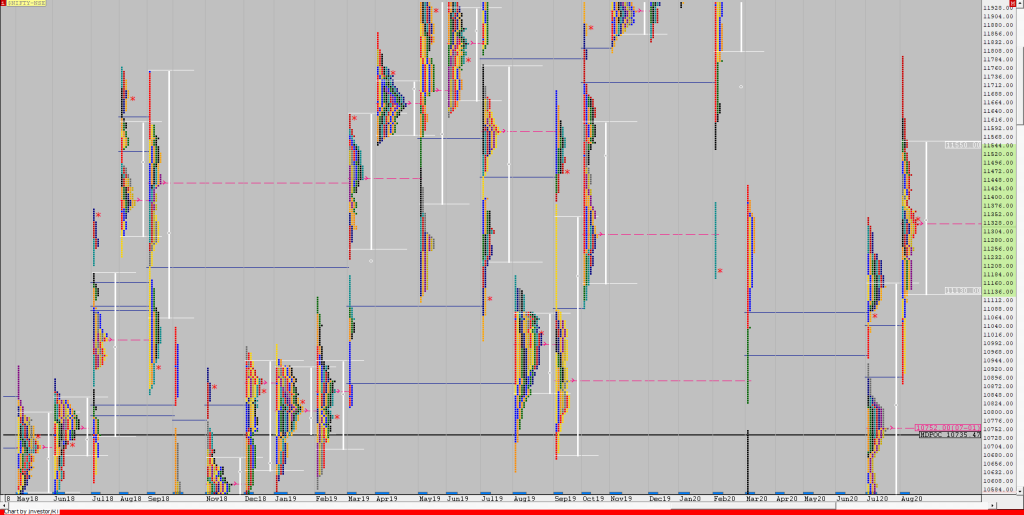
Nifty Spot Weekly Profile (14th to 18th Sep 2020) Spot Weekly – 11505 [ 11618 / 11383 ] Previous week’s report ended with this ‘The weekly profile is a Neutral Extreme one with overlapping to lower Value at 11310-11412-11466 with a close near the VAH so will need to stay above it in the coming […]
Order Flow charts dated 18th September 2020

Trading Order Flow allows a trader to see the specific price where a trade has hit the market, along with the volume of that trade. This information is extremely valuable and allows a trader to generate substantial revenue by using this information to trade. The way we see it is that Order Flow trading is […]
Market Profile Analysis dated 17th September 2020
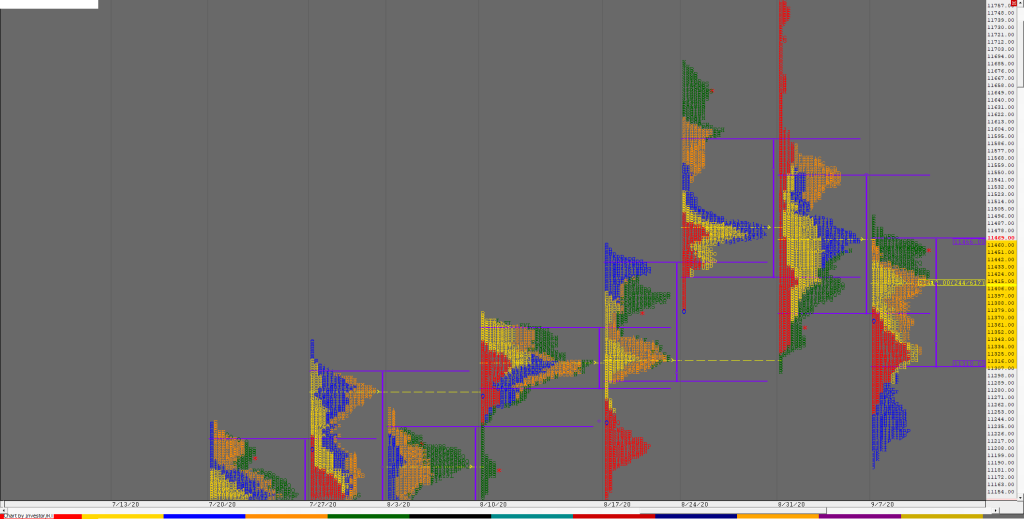
Nifty Sep F: 11522 [ 11578 / 11483 ] NF made a gap down of 95 points rejecting the Neutral Extreme reference of 11603 to 11627 if had left the previous day and took support just above PDL (Previous Day Low) as it made a low of 11515 in the opening minute after which it […]
Order Flow charts dated 17th September 2020

Many traders are used to viewing volume as a histogram beneath a price chart. This approach shows the amount of volume traded below the price Bar. The Order Flow approach is to see the Volume traded inside or within the price bar, an important distinction. Order Flow trading is thinking about what order market participants […]
Market Profile Analysis dated 16th September 2020
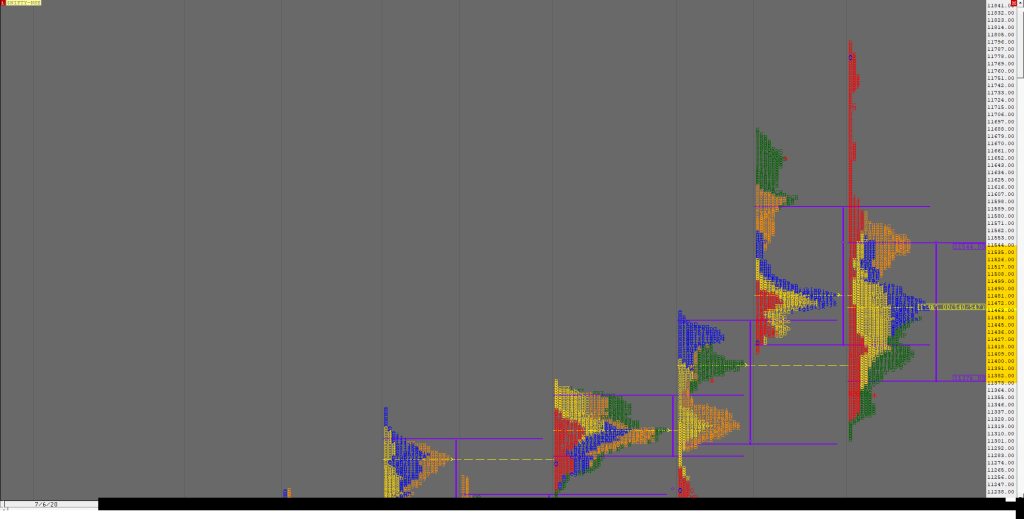
Nifty Sep F: 11616 [ 11627 / 11511 ] NF opened above previous Value giving a rare follow up to a NeuX profile which was a bullish sign though it struggled on the upside in the IB as it could not even tag the vPOC of 11550 making a narrow range of just 37 points […]
