Market Profile Analysis dated 7th November
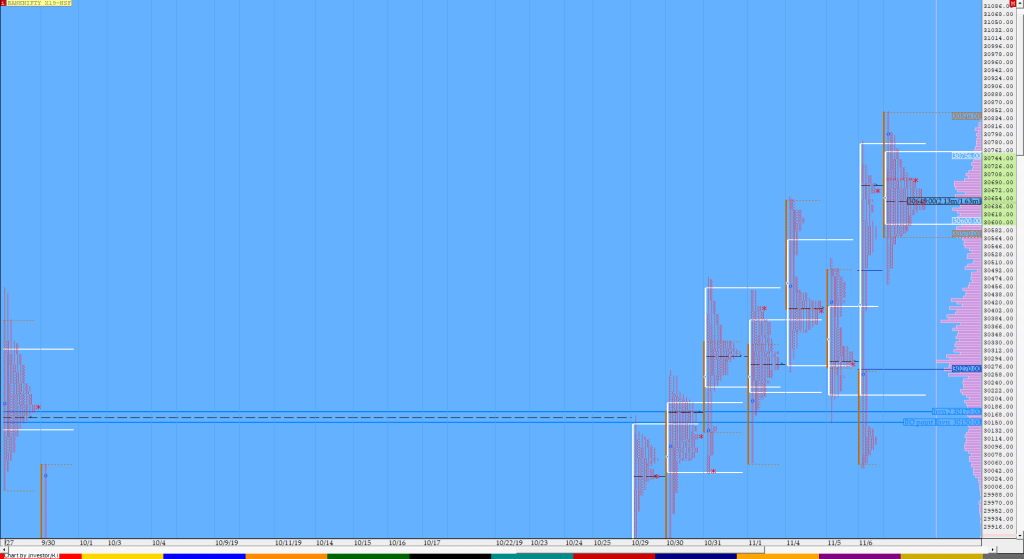
Nifty Nov F: 12048 [ 12058/ 11972 ] HVNs – 11667 / 11814 / 11860 / 11905 / 11958 / 12004 / 12034 NF opened in the upper distribution of the previous day’s profile and made an attempt to probe higher but could not get above PDH because of lack of demand and this triggered a […]
Order Flow charts dated 7th Nov
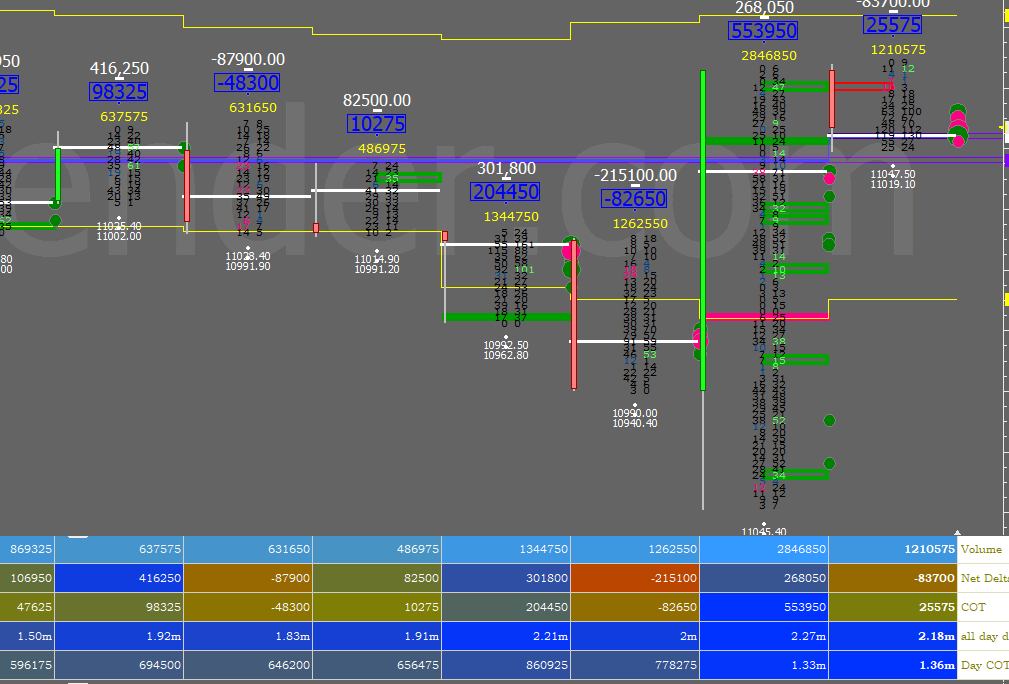
Order Flow trading is thinking about what order market participants do and when you think along this, you can anticipate what kind of action they will be taking in the market. This is a very important concept in Order Flow. Market participants always look for the weaker side of the market, so both buy and […]
Order Flow charts dated 7th Nov (5 mins)
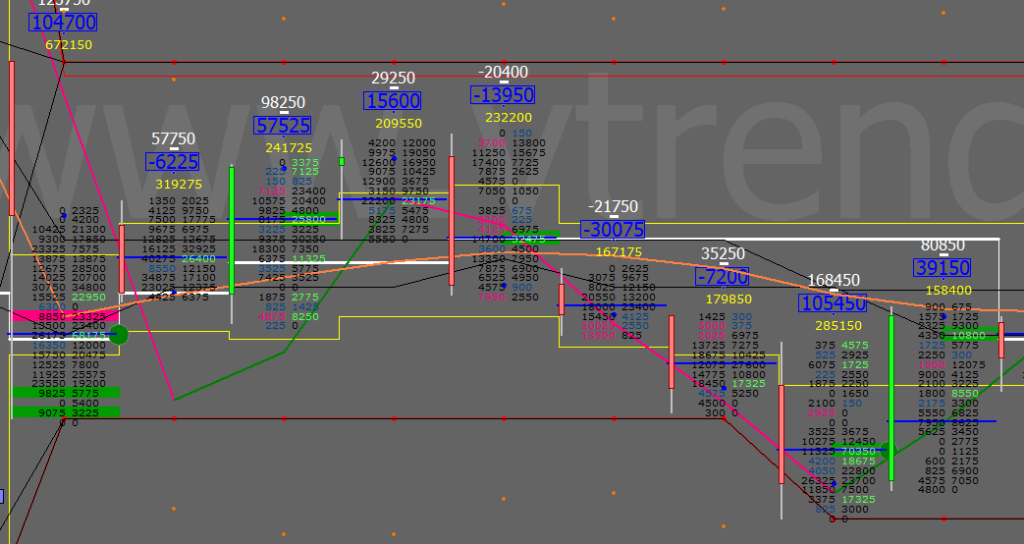
Order Flow trading is thinking about what order market participants do and when you think along this, you can anticipate what kind of action they will be taking in the market. This is a very important concept in Order Flow. NF BNF
Market Profile Analysis dated 6th November
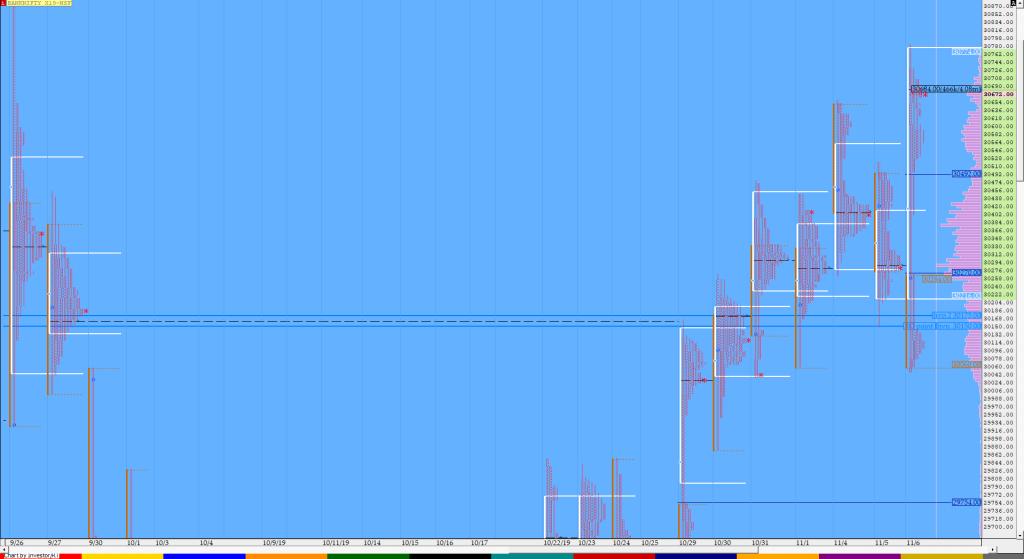
Nifty Nov F: 12008 [ 12050/ 11885 ] HVNs – 11667 / 11814 / 11860 / 11905 / 11958 / 12004 Report to be updated… (Click here to view the 5-day composite profile in NF) The NF Open was an Open Drive Down (OD) on low volumes which failed The day type was a Neutral Extreme […]
Order Flow charts dated 6th Nov

Trading Order Flow allows a trader to see the specific price where a trade has hit the market, along with the volume of that trade. This information is extremely valuable and allows a trader to generate substantial revenue by using this information to trade. The way we see it is that Order Flow trading is […]
Order Flow charts dated 6th Nov (5 mins)

Order Flow can show how a collection of market participates has acted in the past and this helps to create profit by knowing if these traders are profitable or caught upside down. NF BNF
Market Profile Analysis dated 5th November
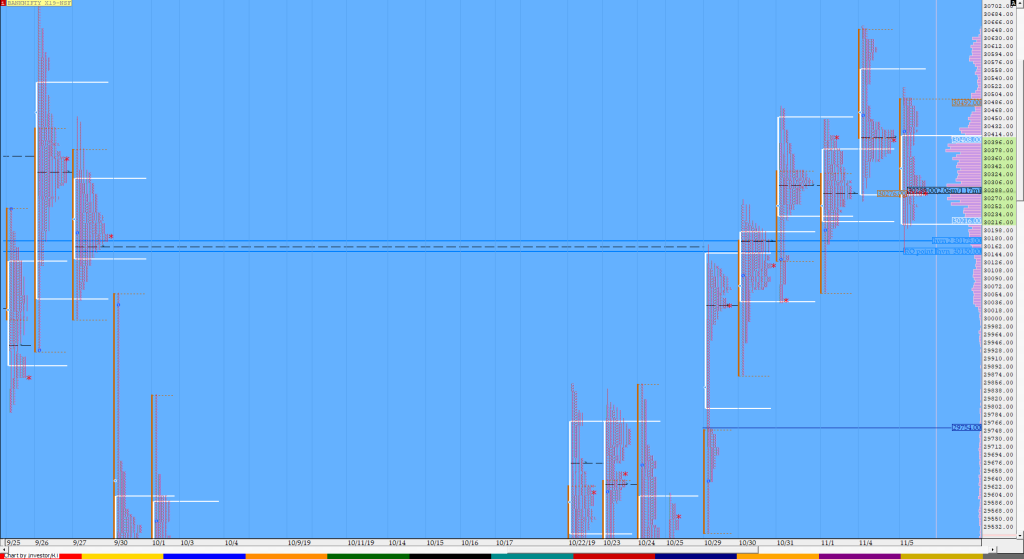
Nifty Nov F: 11956 [ 11997/ 11901 ] HVNs – 11667 / 11814 / 11860 / 11905 / 11958 NF opened higher but got rejected at previous day’s VAH as it made a high of 11997 in the opening minutes after which it made completed the 80% Rule in previous day’s Value in the A period […]
Order Flow charts dated 5th Nov

Many traders are used to viewing volume as a histogram beneath a price chart. This approach shows the amount of volume traded below the price Bar. The Order Flow approach is to see the Volume traded inside or within the price bar, an important distinction. Order Flow trading is thinking about what order market participants […]
Order Flow charts dated 5th Nov (5 mins)

Order Flow is best understood as a way to see existing bias in the markets. Order Flow helps us understand who is in control of the market and who is ‘upside down’ and likely to make exits from that position in a loss. NF BNF
Market Profile Analysis dated 4th November
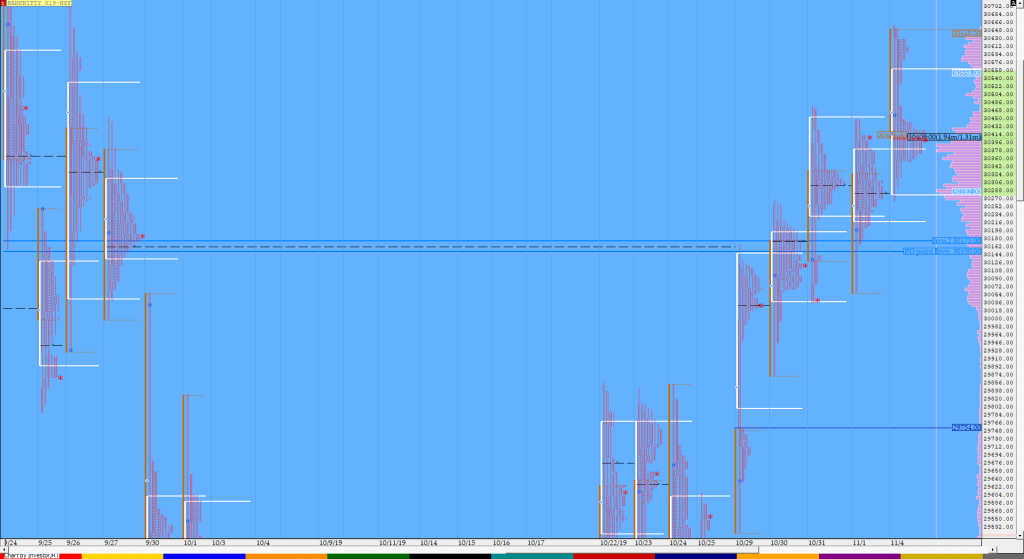
Nifty Nov F: 11980 [ 12013/ 11936 ] HVNs – 11667 / 11814 / 11860 / 11910-920 / (11936) / 11980 NF opened with a gap up confirming the multi-day FA at 11895 and drove higher though on lower volumes as it scaled above PDH and went on to take out the previous week’s high also […]
