Market Profile Analysis dated 07th September 2020
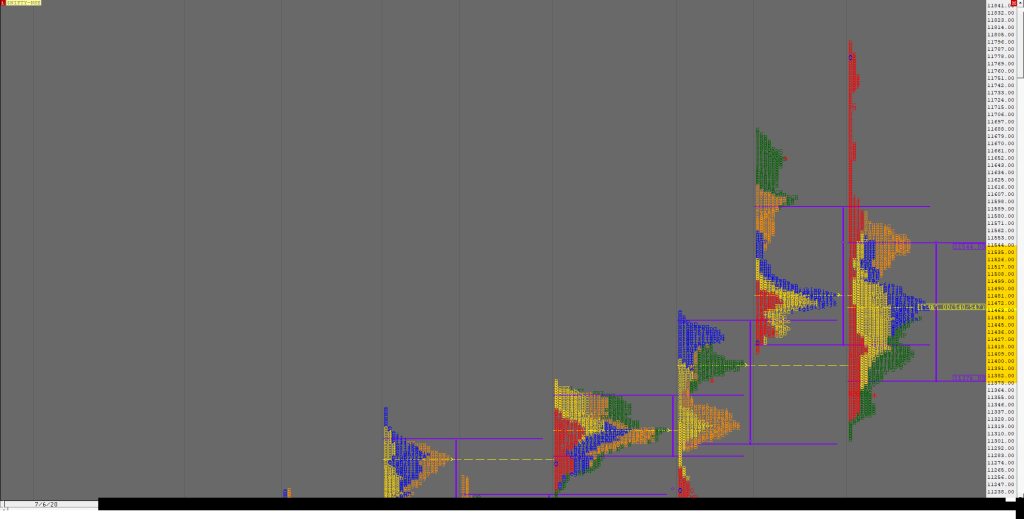
Nifty Sep F: 11366 [ 11393 / 11266 ] NF opened right at Friday’s close and made a quick probe higher as it tested the yPOC of 11370 in the opening minutes but was swiftly rejected as it drove down breaking below previous week’s low of 11310 and went on to tag 11266 right at […]
Market Profile Analysis dated 04th September 2020

Nifty Sep F: 11352 [ 11473 / 11310 ] NF opened with a big gap down of 159 points on Friday but took support just above the recent lows of 11350 in the IB after which it made a OTF probe higher for most part of the day almost closing the daily gap as it […]
Weekly charts (31st August to 04th September 2020) and Market Profile Analysis
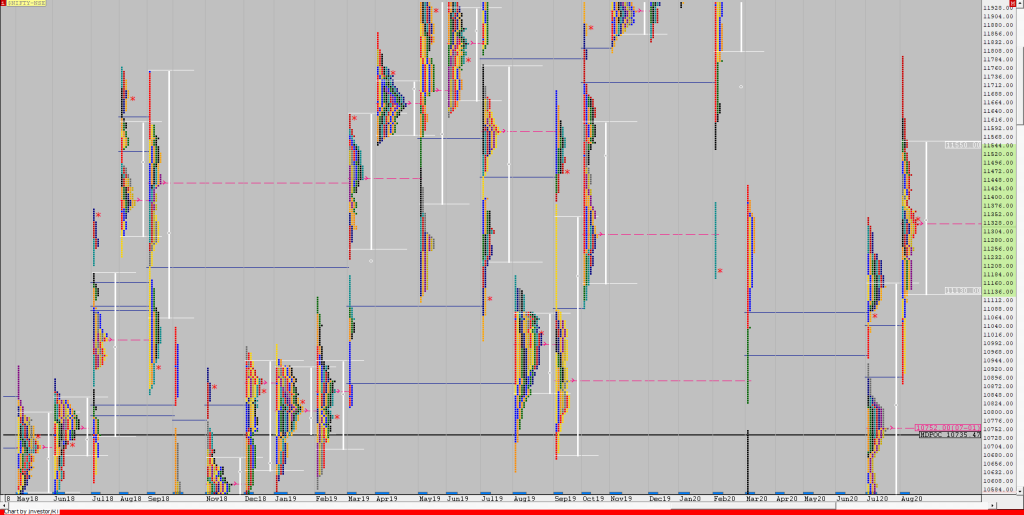
Nifty Spot Weekly Profile (31st Aug to 04th Sep 2020) Spot Weekly – 11333 [ 11794 / 11303 ] Previous week’s report ended with this ‘This week’s Value is mostly higher at 11421-11481-11589 and it remains to be seen if this imbalance continues in the coming week or gives way to a balance being formed’ […]
Market Profile Analysis dated 03rd September 2020
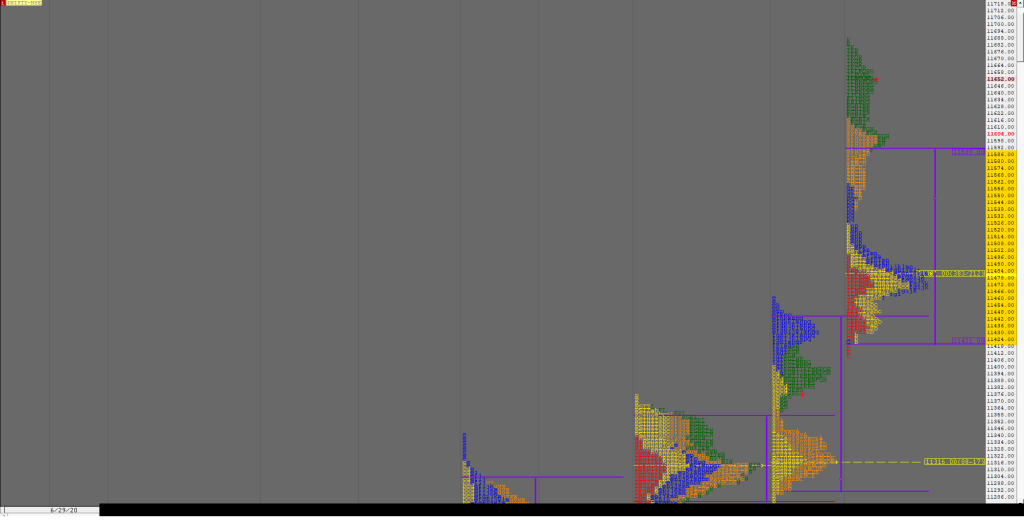
Nifty Sep F: 11542 [ 11595 / 11511 ] NF opened higher giving a rare follow up to a Neutral Extreme profile as it tagged the 1 ATR target of 11587 from previous day’s FA of 11445 but lack of fresh demand saw it getting rejected from 11595 as it got back into previous day’s […]
Market Profile Analysis dated 02nd September 2020

Nifty Sep F: 11561 [ 11576 / 11445 ] NF opened lower but continued to form a balance in the 2-day composite as it took support just above the composite POC in the ‘A’ period where it made a low of 11462 after which it probed higher to leave a high of 11533 in the […]
Monthly (August 2020) charts and Market Profile Analysis
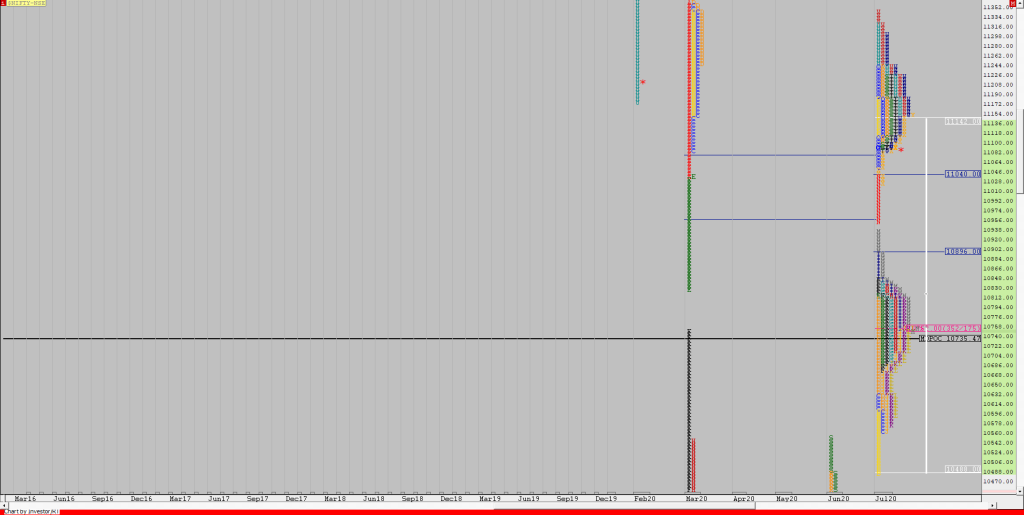
Nifty Spot – 11387 [ 11794 / 10882 ] Monthly Profile (August 2020) Previous month’s report ended with this ‘The monthly profile has a buying tail from 10562 to 10299 and completely higher Value at 10490-10803-11142 with the DD (Double Distribution) singles or another buying tail in the middle of the profile from 10896 to […]
Market Profile Analysis dated 01st September 2020

Nifty Sep F: 11511 [ 11590 / 11373 ] NF opened higher right at the immediate PBH of 11448 and got rejected as it formed a large 80 point range in the first 5 minutes while making a low of 11373 still unable to break below previous day’s poor lows in the zone of 11350 […]
Market Profile Analysis dated 31st August 2020

Nifty Sep F: 11402 [ 11794 / 11350 ] NF opened higher by 90 points and went on to tag 11795 in the opening minutes but saw a combination of profit booking as well as big supply coming in at these new highs which led to a huge trending move lower of 444 points as […]
Market Profile Analysis dated 28th August 2020

Nifty Sep F: 11675 [ 11698 / 11602 ] Report to be updated… Click here to view the latest profile chart of NF on MPLite The NF Open was a Open Auction (OA) The Day type was a Normal Variation Day – Up (NV) Largest volume was traded at 11630 F Vwap of the session was […]
Weekly charts (24th to 28th August 2020) and Market Profile Analysis
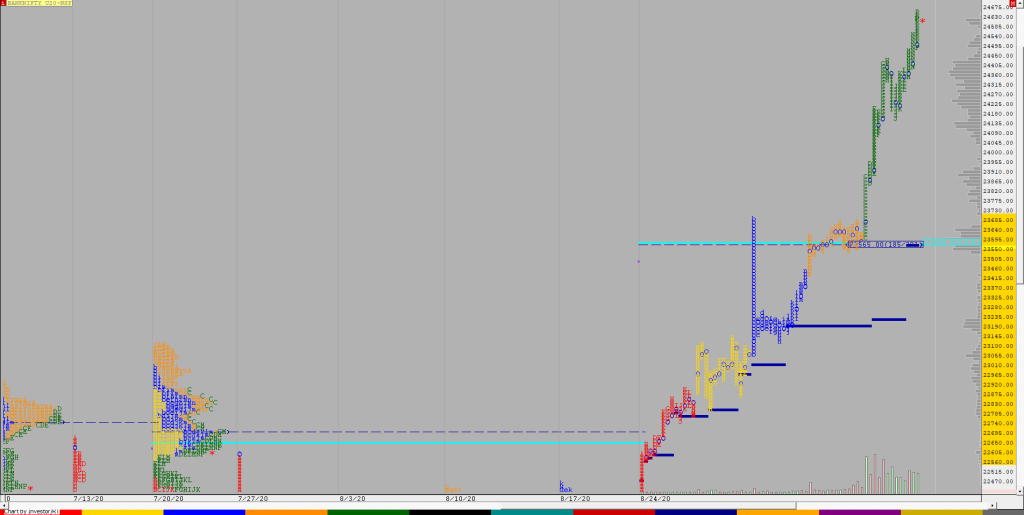
Nifty Spot Weekly Profile (24th to 28th Aug 2020) Spot Weekly – 11647 [ 11686 / 11410 ] Previous week’s report ended with this ‘The weekly profile represents Triple Distribution with three daily VPOCs at 11206 / 11334 & 11435 and overlapping to higher Value at 11292-11316-11442. The immediate reference on the upside would be […]
