Order Flow charts dated 04th December 2020

Many traders are used to viewing volume as a histogram beneath a price chart. But the Order Flow approach shows the amount of volume traded during each price bar, and also it breaks this volume down into the Volume generated by the Buyers and the Volume generated by the sellers again at every row of […]
Market Profile Analysis dated 03rd December 2020

Nifty Dec F: 13192 [ 13228 / 13153 ] NF opened with a gap up as it moved away from the 2-day balance to tag new highs of 13220 at open but remained stuck in a narrow range of just 49 points in the IB (Initial Balance) getting rejected from previous day’s range as it […]
Order Flow charts dated 03rd December 2020

When we think about how to measure volume in the market one of the keys is Order Flow. It plays a role by telling us what the other traders have done in the market and are currently doing and this provides valuable clues and potential opportunities to trade. An Order Flow trader can actually see […]
Market Profile Analysis dated 02nd December 2020

Nifty Dec F: 13162 [ 13177 / 13018 ] NF made another OAIR start on low volumes and got rejected from previous VAH as it made a high of 13161 in the opening minutes and probed lower almost completing the 80% Rule in the IB (Initial Balance) as it made a low of 13104 leaving […]
Order Flow charts dated 02nd December 2020

Timing is the key to successfully trade the markets in the shorter time frame. Order Flow is one of the most effective methods to time your trades by seeing exactly what the other traders are trading in the market and positioning your bias accordingly. Order Flow is the most transparent way to trade and takes […]
Market Profile Analysis dated 01st December 2020

Nifty Dec F: 13143 [ 13168 / 12993 ] NF made an OAIR start (in previous day’s range as well as value) with low volumes and took support at Friday’s VAL as it made a low of 12993 in the opening minutes after which it made a slow OTF (One Time Frame) probe higher all […]
Order Flow charts dated 01st December 2020

The key to using Order Flow trading is to determine market depth. This describes the places where Market participants have taken positions or the zone they have transacted. The Order Flow is like a list of trades and helps to know how other traders are placed in the market. Vtrender helps you to stay on […]
Market Profile Analysis dated 27th November 2020

Nifty Dec F: 13017 [ 13094 / 12966 ] NF opened in the spike zone of 12994 to 13052 and was rejected in an attempt to probe higher from 13065 after which it went on to test the other end of the spike but once again got rejected after it made a low of 12988 […]
Weekly Charts (23rd to 27th November 2020) and Market Profile Analysis

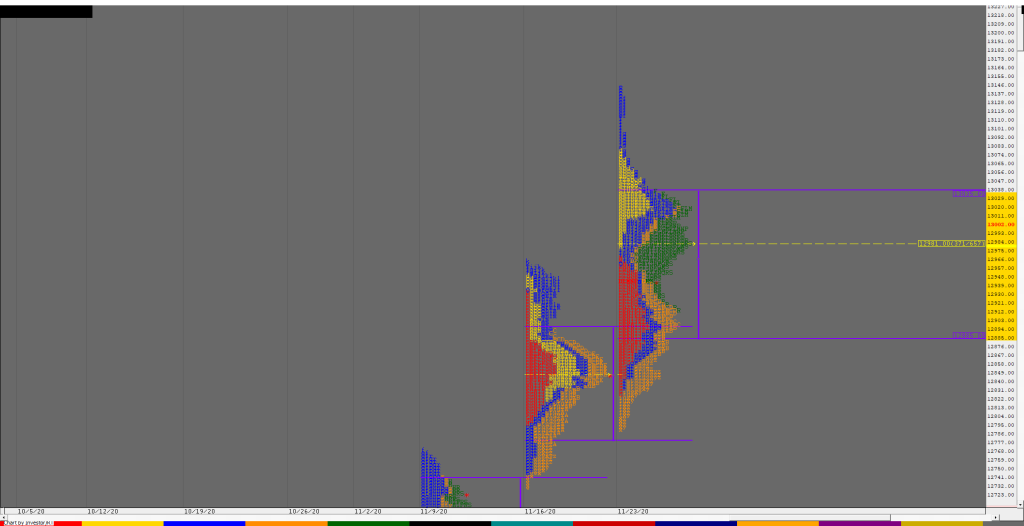
Nifty Spot Weekly Profile (23rd to 27th Nov 2020) Spot Weekly – 12969 [ 13146 / 12790 ] Previous week’s report ended with this ‘The weekly profile is a well balanced Neutral Centre one with completely higher Value at 12780-12846-12894 and needs an initiative move away from this week’s prominent POC to signal return of […]
Monthly charts (November 2020) and Market Profile Analysis

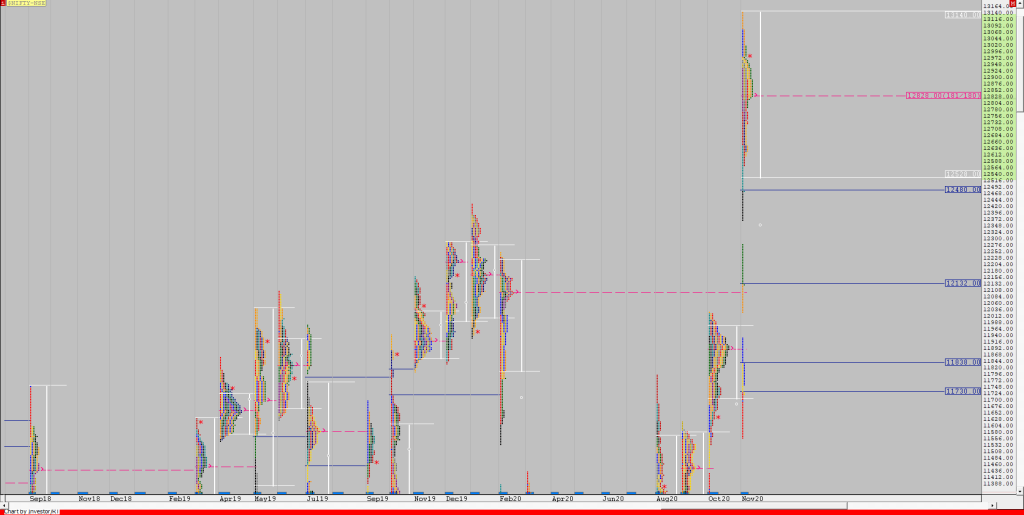
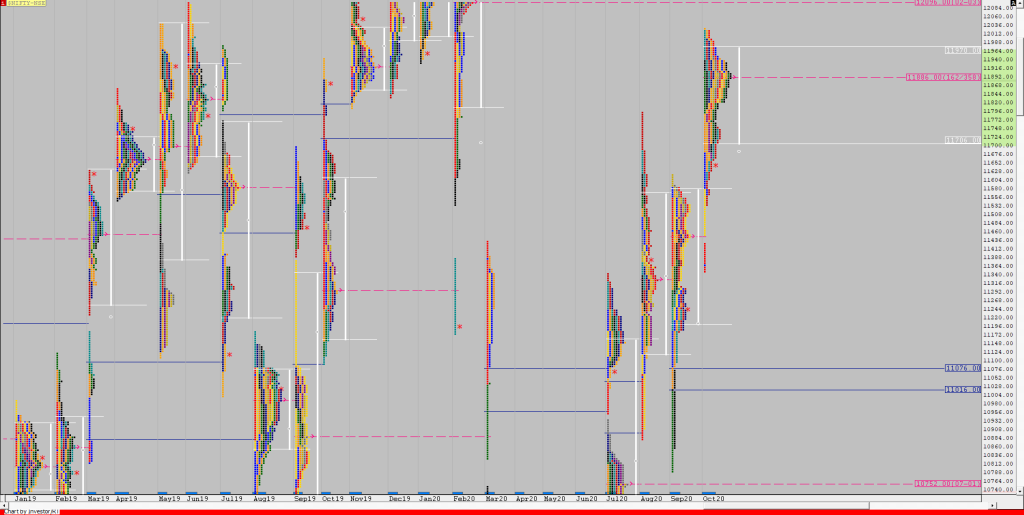
Nifty Spot – 12969 [ 13146 / 11557 ] Monthly Profile (November 2020) Previous month’s report ended with this ‘The monthly profile represents a ‘p’ shape with Value completely higher at 11706-11897-11970 but has closed not just below the POC of the profile but also the VAL which means that the PLR would be to […]
