Weekly charts (25th to 29th November) and Market Profile Analysis

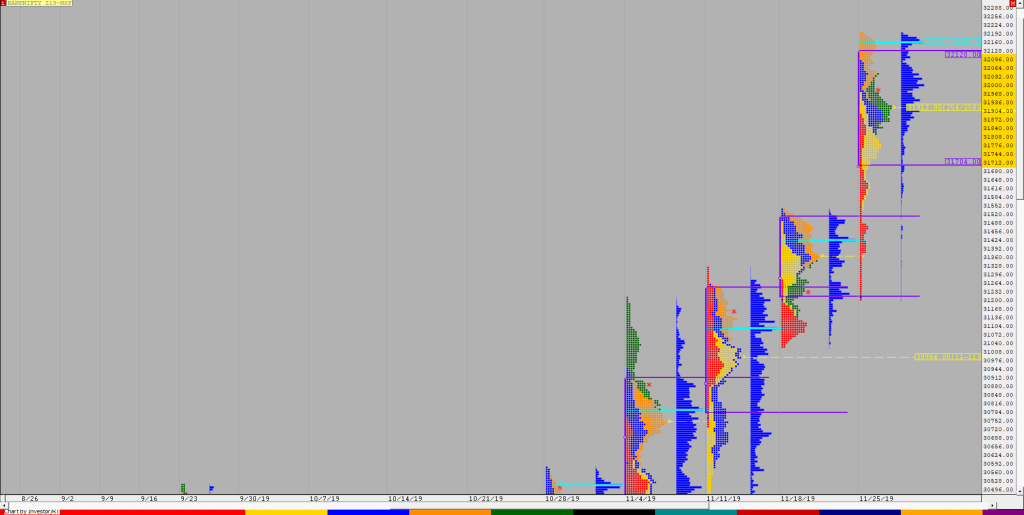
Nifty Spot Weekly Profile (25th to 29th November) Spot Weekly 12056 [ 12159 / 11919 ] Previous week’s report ended with this ‘On an even higher time frame, it seems like the auction has completed this phase of Steidlmayer Distribution (you can read about this here) after it started a new IPM (Initial Price Movement) […]
New Pricing Structure – Vtrender Trading Room
Hello Traders, We’re writing to inform you that on Nov 1, 2019, the list price of the Vtrender Trading Room will increase to INR 14999/- for the Monthly Plan, to INR 39999/- for the quarterly Plan and INR 99999/- for the Annual Plan. There is a complete overhaul in not just the pricing, but also the structure of the Vtrender […]
What is exactly the Orderflow?
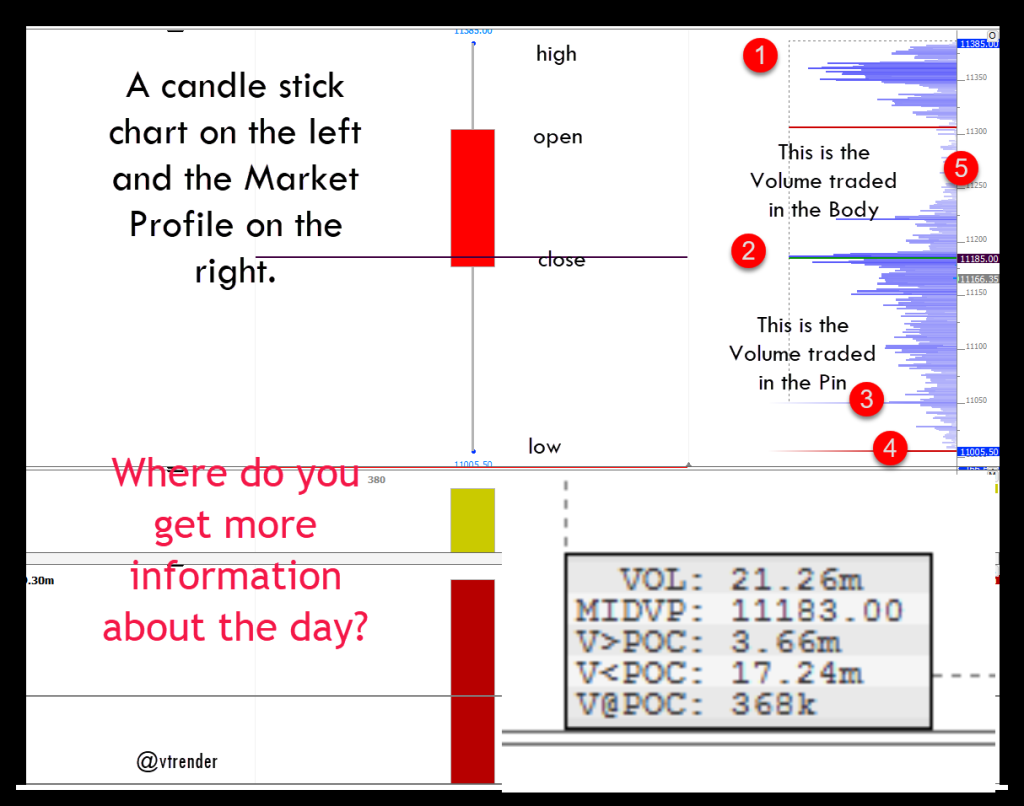
What is this term called Orderflow? and how does knowing it help my trading? Orderflow simply means reading the demand and supply side of the market. Because it is read live and based on current actual traded volumes of the market, we have what are called Orderflow charts. Orderflow replicates the transactions taking at the […]
How a Market Profile chart gives an edge to trade

There are times the markets move the average range in say a widely traded instrument such as the Nifty futures. These are the times the markets are quieter and confirming to the normal, and most traders and most systems of trading would be good enough to get you through to profits, in your chosen strategy. […]
Level 1- Market Profile Essentials

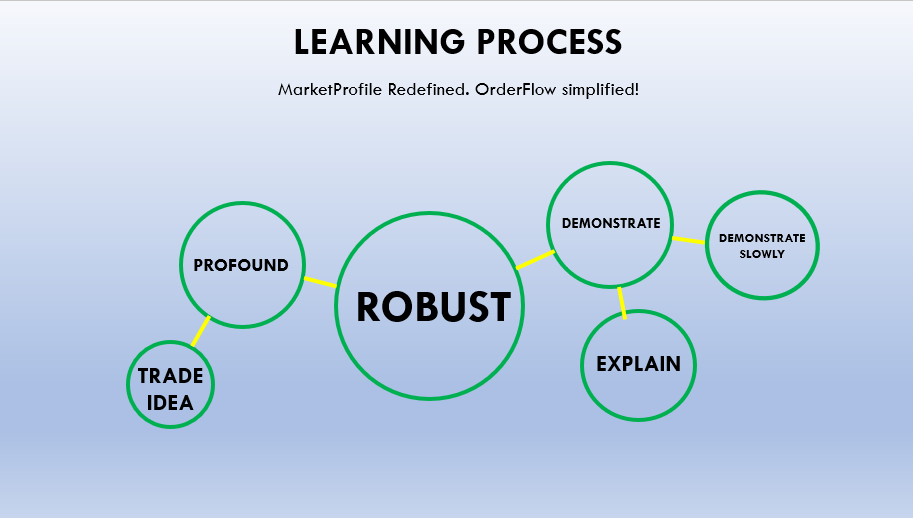
The trading community at Vtrender trades on MarketProfile and uses OrderFlow to plot entries and exits for the trades. Below is a short 15-minute presentation which will give you a good understanding on a) what constitutes a good learning process b) how to master a trading process c) how MarketProfie gives you an edge […]
Market Profile The evolution
After my last post on Market Profile in May, I received a lot of email on the different theories and concepts which all get aggregated in one common term called the “Market Profile”. Truth be told, there are 3 variations of the Market Profile and at Vtrender we follow all the 3 variations completely and we could […]
Vtrender Performance Register 2016
In the year 2016, our portfolio graph surged 124% through the year in a period of down, then up and then sideways markets. In the first 2 months of the year when the markets were mostly down in Jan and Feb our Portfolio returned 23.5 % and 18.5% respectively. In a market which went […]
Vtrender performance register 2019
Our Belief is in Market Profile and in Order flow. The Market Profile is a unique charting tool that enables traders to observe the two-way auction process that drives all market movement. The Market Profile will guide traders through a new understanding of the market that will allow them to identify the most profitable trade opportunities as they happen. The […]
Market Profile analysis with Monthly and Weekly charts
Nifty Spot Monthly Profile (Oct) Nifty Spot has made a ‘b’ profile on monthly indicating a long liquidation profile & the monthly close at 10386 which was well above the monthly POC of 10275 indicates short term exhaustion of sellers. Monthly Zones: The vwap of the October series is at 10490 spot and the POC […]
MarketProfile charts dated 06th Sept
MarketProfile charts dated 06th Sept MarketProfile charts of the Nifty and the BankNifty Sept Futures updated to trade date 06th Sept A “market profile” presents a number of basic elements from the market in an easily understood graphic format , when analyzed properly. A trader must first learn to understand how the market works. This […]
