Our Belief is in Market Profile and in Order flow.
The Market Profile is a unique charting tool that enables traders to observe the two-way auction process that drives all market movement. The Market Profile will guide traders through a new understanding of the market that will allow them to identify the most profitable trade opportunities as they happen.
The Order flow is used to pinpoint the accuracy for entries and the exits. It is the most advanced system for execution of trades and the purest format of Demand and Supply .
If the markets move a 100 points in a day, a traditional technical analysis would give you 100 different “levels” and the “level” of one analysis would be different from the “level” of another. Order flow is the only real time indicator which can show you the correct levels to enter or exit trades allowing a trader to eliminate many mistakes and trade only quality calls.
We take a lot of trades Live in the Trading Room, which also has Order flow and Market Profile charts live . We do not risk more than 1% of our capital per intra day trade and more than 3% for a positional trade. These rules of money management are essential for the long term benefit of the account. A detailed primer on how to trade as a professional trader would, is sent in the welcome kit when you subscribe to Premium .
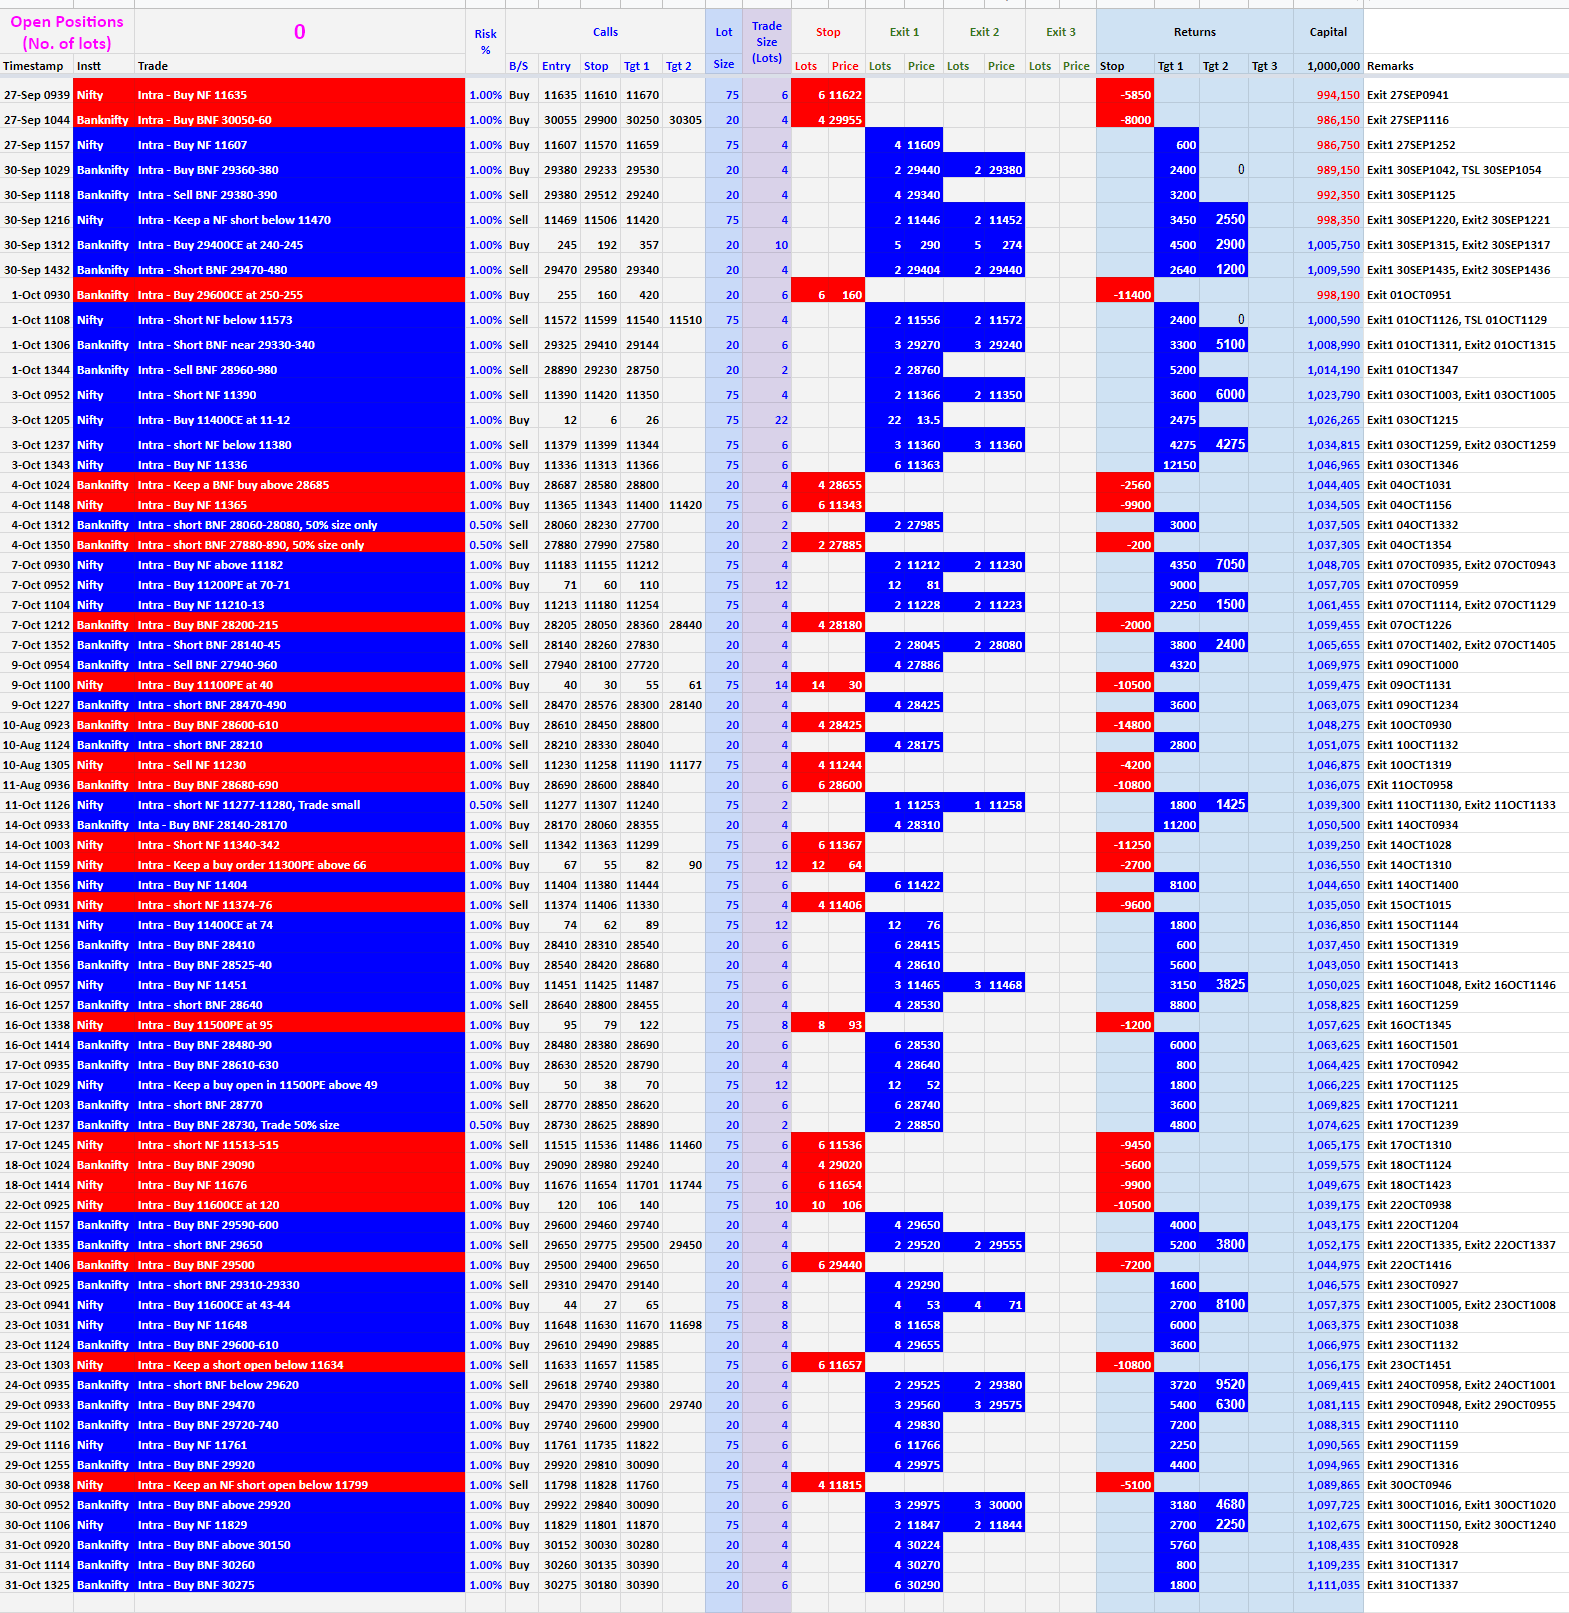
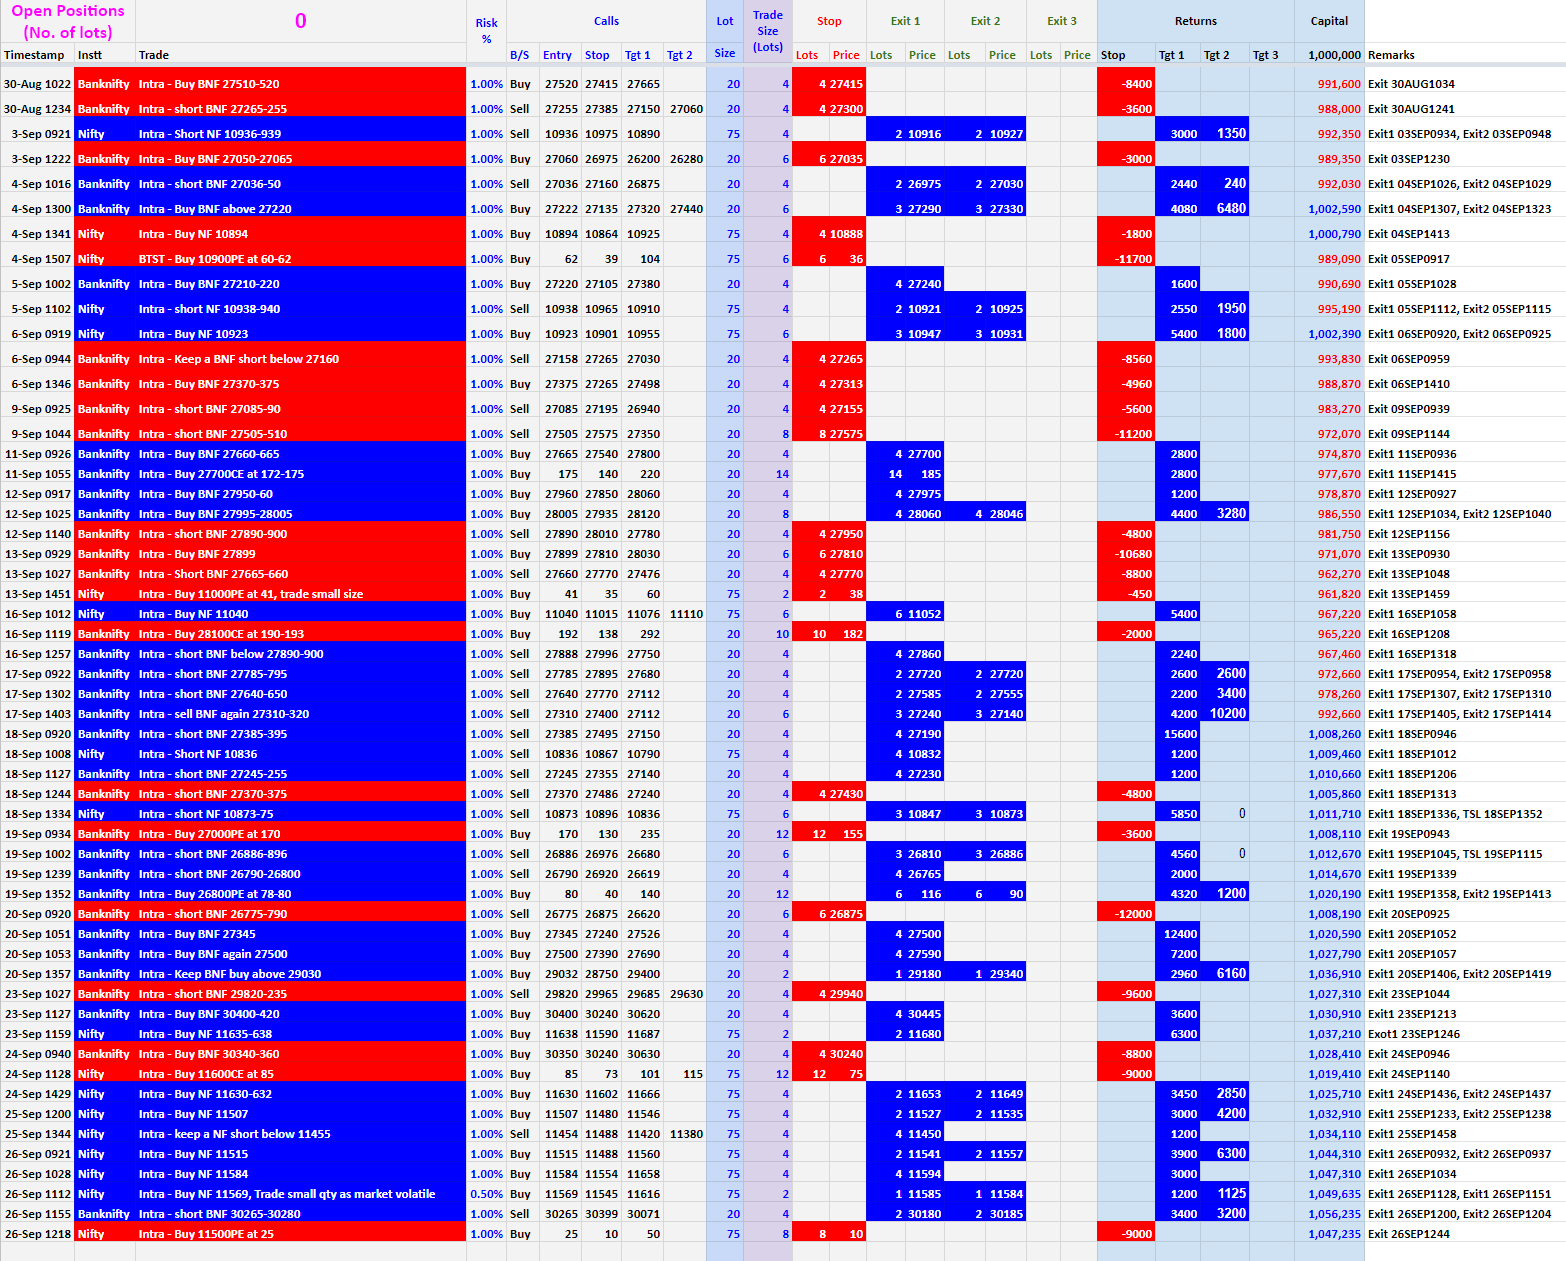
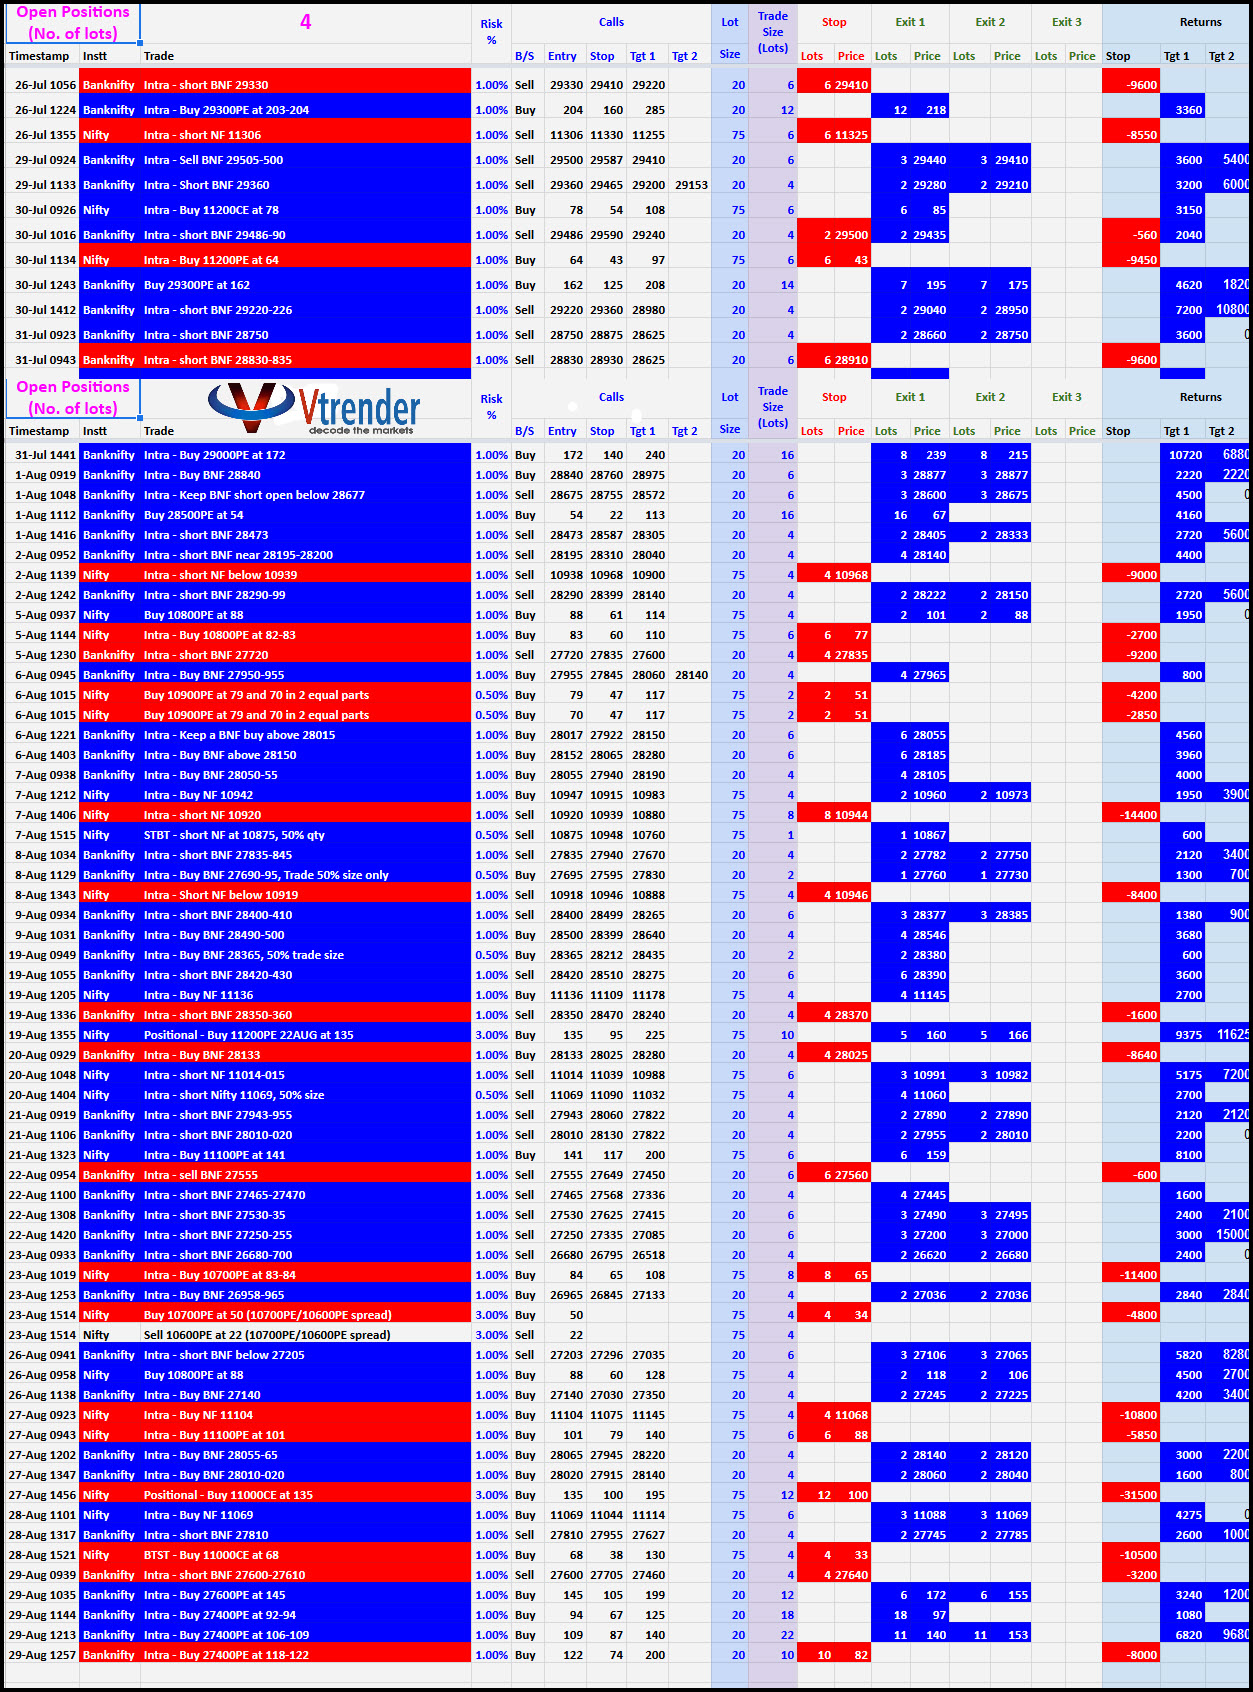
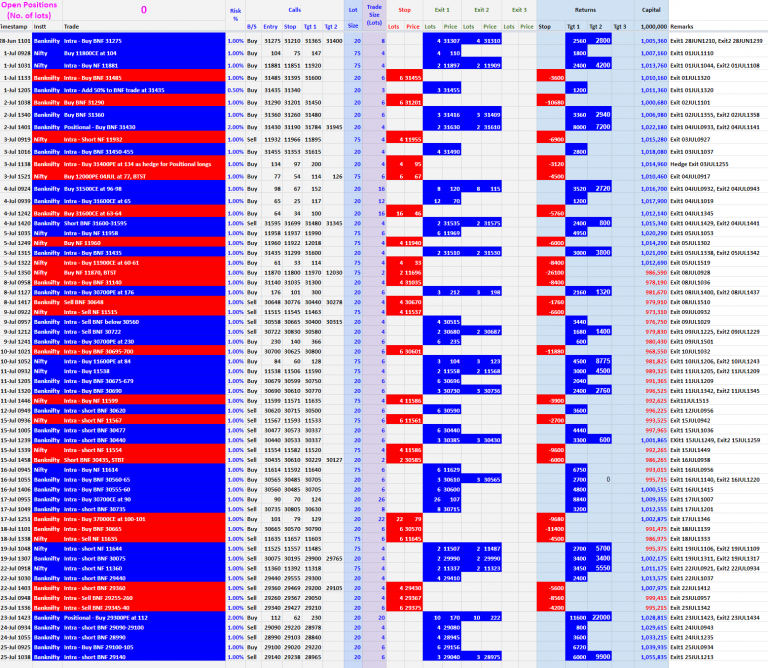
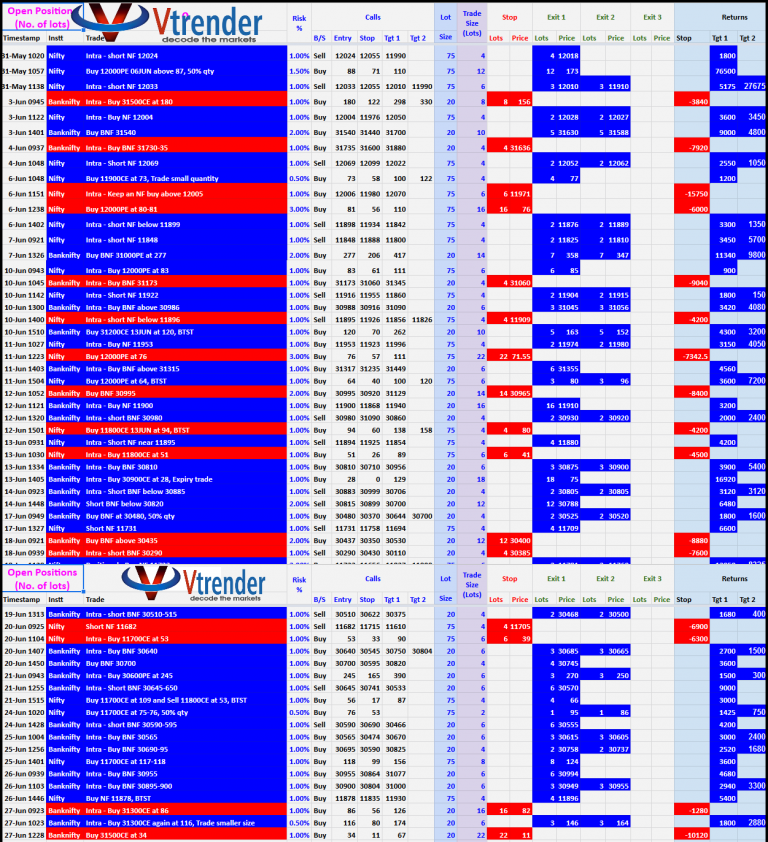
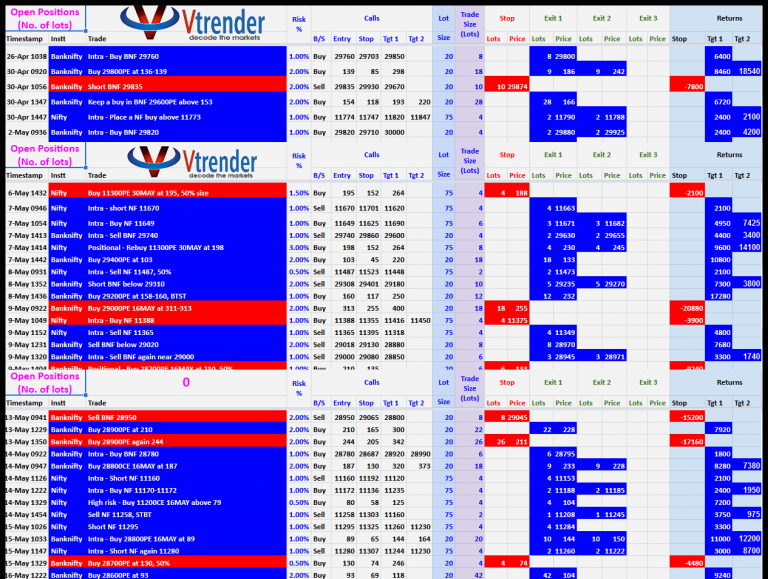
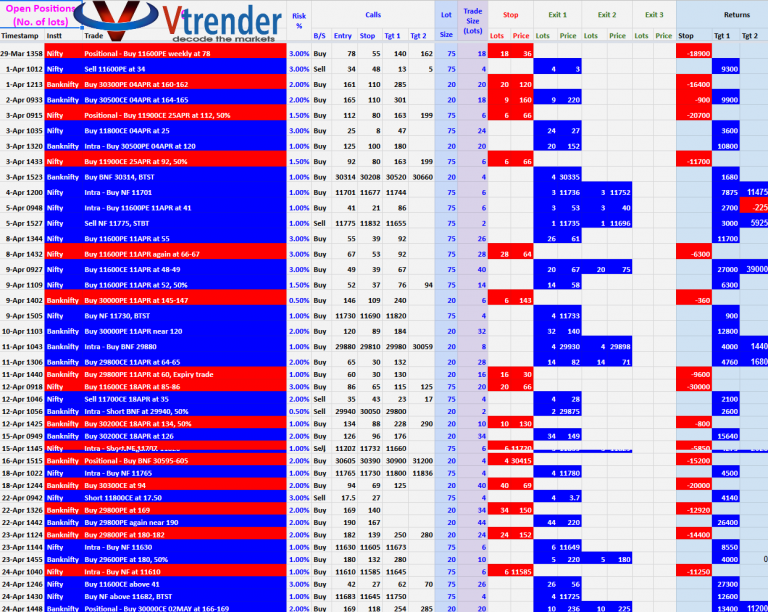
It is not possible for us to put all the trades we take here on this sheet , but here are a few we send to our private Slack channel. Do remember the trading room has many many more and the trades below are just a fraction of the work we do in the Vtrender Trading Room.
This page will be updated with trading positions taken through 2019. From the 15th of March 2019 we moved to a new system of trading with our bots “Heatseeker” and “Alerto” . These are system signal trades below sent to our Slack channel.
The positions traded in 2018 are at –
The positions traded in 2017 are at –
The positions traded in 2016 are at – https://vtrender.com/vtrender-performance-register-2016/
Net from Match 15- 2019
Oct :
Sept :
Aug :
July :
June :
May :
March –
April :


