Nifty Spot: 19638 [ 19766 / 19492 ]
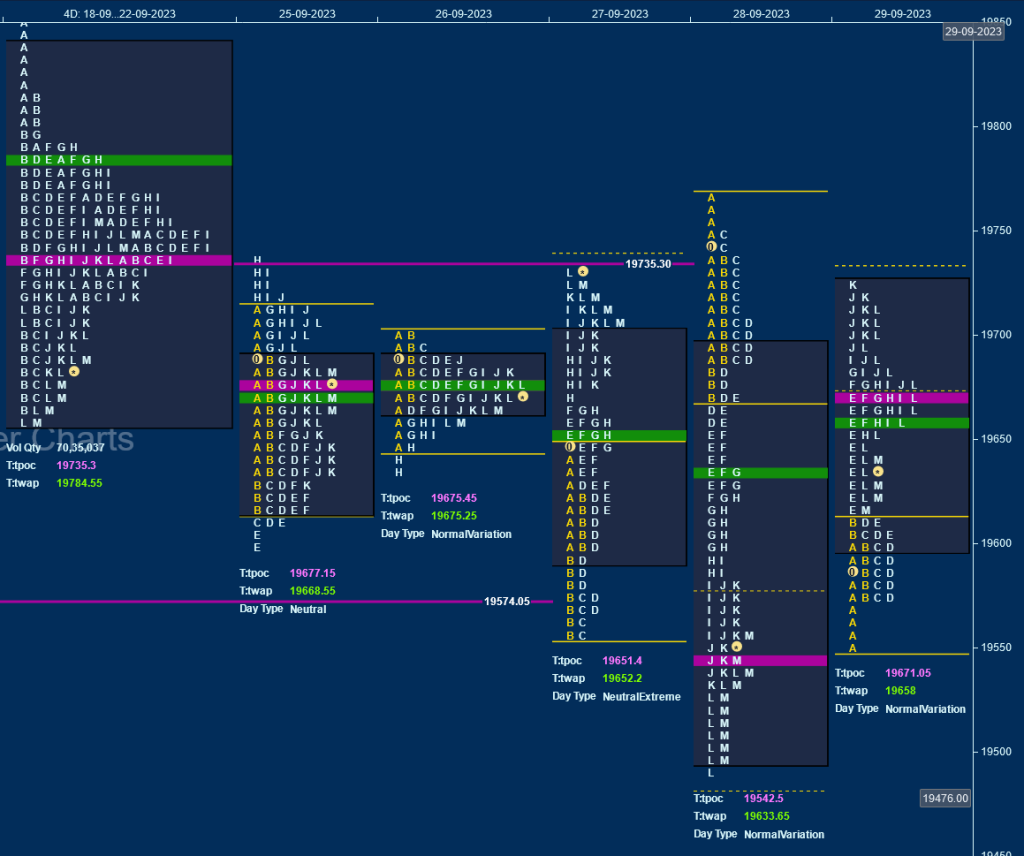
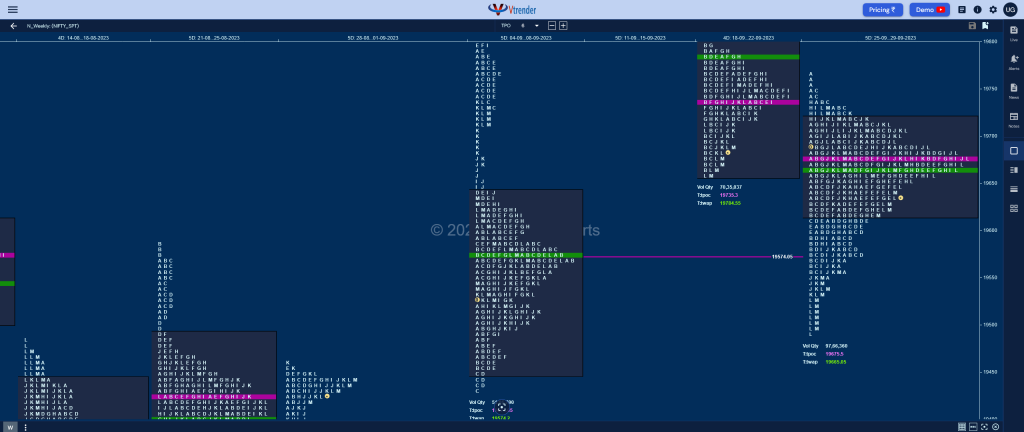
Previous week was a long liquidation Triple Distribution Trend One to the downside in a huge range of 538 points with the upper extension handle at 20121 with a zone of singles till 20017 and another extension handle at 19885 with a zone of singles till 19767 forming completely lower Value at 19567-19735-19841 and has left an ultra prominent 2-day POC at 19735 along with daily VPOCs at 19953 & 20177 which will be the important levels to watch on the upside whereas on the downside, this week’s poor lows of 19657 which has stalled just above the buying extension handle of 19652 will be the immediate support below which Nifty can go for a tag of the lower weekly VPOC of 19574 and the 2 ATR objective of 19517 from the daily FA of 19798

Monday
Nifty opened with a probe lower in the Initial Balance (IB) repairing the poor lows of 19657 from previous week as it hit 19617 and made a hat-trick of Range Extensions (RE) lower but could only manage to tag 19601 indicating lack of fresh supply and went on to reverse the probe to the upside even making an extension in the H TPO where it made new highs of 19734 stalling right below previous week’s POC of 19735 resulting in a Neutral Centre Day
Tuesday
The auction remained in a narrow 62 point range forming a Normal Day filling up previous profile as it formed an ultra prominent POC at 19675 and for the second successive day closed around it
Wednesday
began with a move away from the 2-day balance to the downside as Nifty tagged the lower weekly VPOC of 19574 while making new lows for the week at 19558 in the IB but made the dreaded C side extension to 19554 which was swifty rejected resulting in a FA being confirmed at lows and not only completed the 1 ATR objective of 19685 but spike higher to 19730 leaving a Neutral Extreme (NeuX) Day Up
Thursday
saw a rare follow up to a NeuX profile but opening higher but saw big profit booking along with fresh supply coming in as it made an Open Rejection Reverse start and went on to form an ideal Trend Day Down overlapping the entire week’s range and breaking below the FA of 19554 as it made a low of 19492 but seemed like the selling climax as the dPOC shifted lower to 19542 into the close
Friday
filled up Thursday’s elongated profile after leaving an initiative buying tail from 19574 to 19551 and follwed by an extension handle at 19610 as it formed a Double Distribution Day hitting a high of 19726 once again stalling just below the 19735 reference for this week triggering a liquidation break in the L & M TPOs and retracing down to 19618

The weekly profile is a well balanced Gaussian Curve and a Neutral one which had overlapping Value for all the 5 days of the week resulting in an ultra prominent POC at 19675 forming Value overlapping to lower at 19617-19675-19718 and looks all set to give a move way from this zone as the new month of October gets underway with the downside objectives starting with Thursday’s VPOC of 19542 below which we have the weekly 2 ATR objective of 19416 from 19766 and finally the lower VPOC at 19335 (28th Aug to 01st Sep) whereas on the upside, Nifty will first need to scale above 19718 and find initiative buying for a probe towards the selling tail of 19812 from 21st Sep and the daily VPOC of 19953 from 20th.
Click here to view this week’s MarketProfile of Nifty on Vtrender Charts
Hypos for the week 03rd to 06th Oct 2023
| Up |
| 19652 – SOC from 29 Sep 19718 – Weekly VAH 19766 – Weekly FA (28 Sep) 19812 – Selling Tail (21 Sep) 19871 – Gap mid (21 Sep) 19953 – VPOC (20 Sep) 20017 – Selling Tail (20 Sep) 20057 – Gap mid (20 Sep) |
| Down |
| 19610 – Ext Handle (29 Sep) 19542 – VPOC (28 Sep) 19499 – Buying tail (28 Sep) 19458 – Ext Handle (04 Sep) 19406 – Ext Handle (01 Sep) 19350 – Ext Handle (01 Sep) 19288 – Buying Tail (01 Sep) 19223 – Weekly FA (31 Aug) |
BankNifty Spot: 44584 [ 44936 / 44182 ]
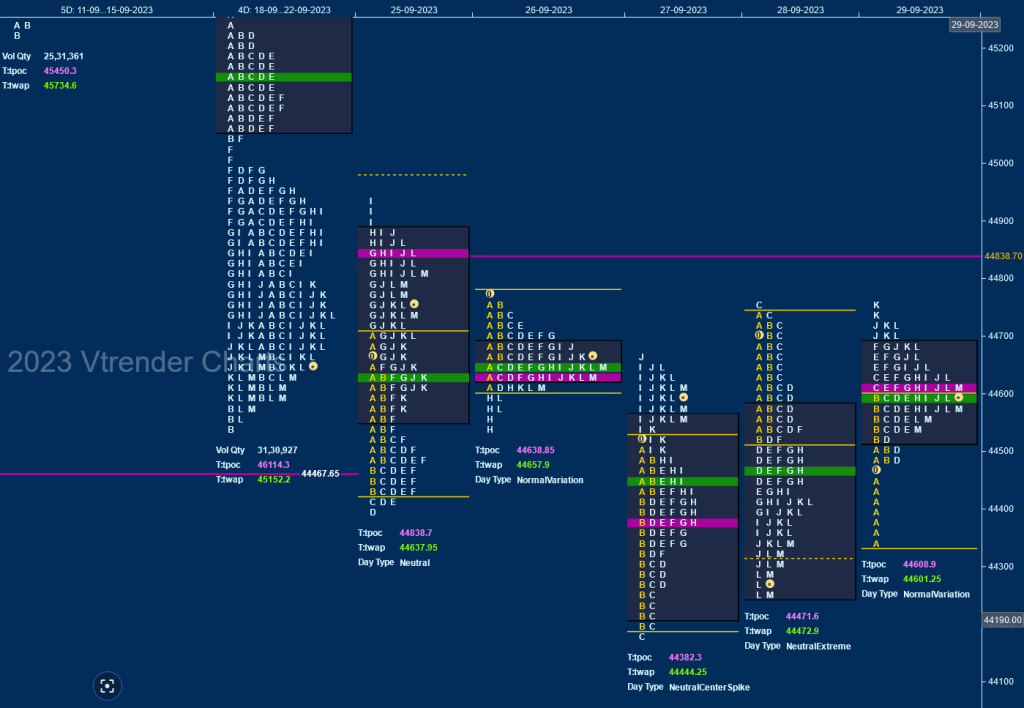
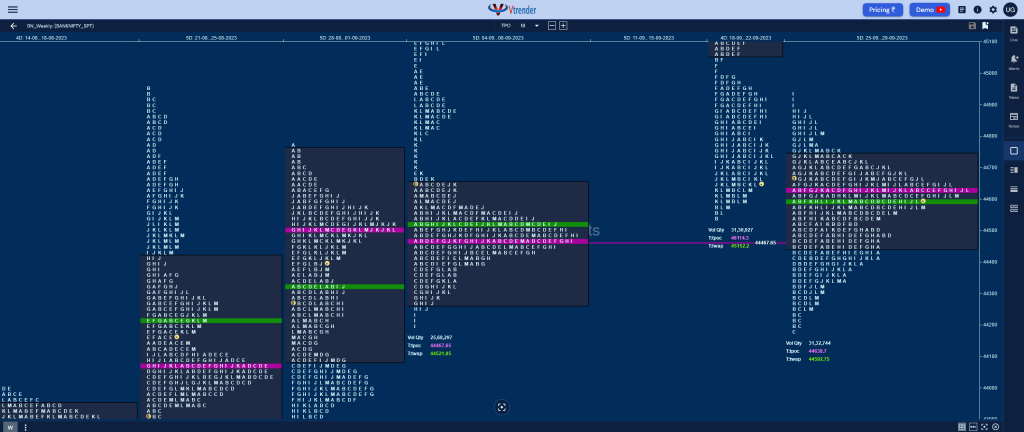
Previous week was a Trend Down One with a huge range of 1704 points from 46252 to 44548 with the POC remaining in the upper part at 46114 followed by four extension handles at 46027, 45725, 45284 & 45066 and a close well below the Value at 45066-46114-46253 looking set to tag the prominent lower weekly VPOC of 44467 and the small buying tail from 44256 to 44207

Monday
BankNifty continued previous week’s imbalance with a probe lower in the IB where it tagged the prominent weekly VPOC of 4467 while making a low of 44425 after which it made couple of REs lower but could only manage to hit 44401 suggesting that the downside move was over for the day after which it not only confirmed a FA at lows but also completed the 1 ATR target of 44868 as it went on to make a high of 44936 where it left a responsive selling tail till 44889 and saw the dPOC shift higher to 44838 indicating profit booking by the buyers
Tuesday
remained in a narrow 241 point range forming an inside bar which filled up the middle part of Monday’s profile staying between the yPOC of 44838 on the upside and the SOC of 44520 on the downside building a prominent POC at 44638 with all but the B TPO stacked up there
Wednesday
The auction started with a probe lower as it not only revisited Monday’s FA of 44401 but went on to make a look down below the weekly singles from 44256 to 44207 as it made a low of 44202 in the IB but made the dreaded C side extension to 44182 which was swiftly rejected resulting in the second FA for the week which completed the 1 ATR objective of 44630 and tagged Tuesday’s prominent POC of 44638 while making a high of 44668 leaving yet another NeuX Day Up
Thursday
BankNifty continued to play FA – FA as this time it played out a typical C side set up confirming the third FA of the week but the first one to come on the upside at 44756 which triggered an OTF (One Time Frame) move lower for the rest of the day completing the 1 ATR target of 44295 while making a low of 44248 completing the 3rd NeuX day of the week
Friday
It was time for balance to return after the back to back NeuX profile in opposite directions as the auction rejected Thursday’s NeuX close not only opening higher but left an initiative buying tail from 44488 to 44344 and made a slow probe higher forming a ‘p’ shape profile for the day as it made a high of 44755 stalling just below the FA of 44756 building a prominent POC at 44609

The weekly profile is a nice Gaussian Curve with completely lower Value at 44446-44638-44741 with an ultra prominent POC at 44638 which will act like a magnet unless we get an initiative move away from this zone with the FA at 44756 being the immediate reference on the upside whereas on the downside, this week’s VAL which coincides with the daily buying tail from 44488 will be the first level to watch below which the FA of 44182 will be the important one to watch.
Click here to view this week’s MarketProfile of BankNifty on Vtrender Charts
Hypos for the week 03rd to 06th Oct 2023
| Up |
| 44638 – Weekly POC 44756 – FA from 28 Sep 44838 – VPOC from 25 Sep 45039 – Ext Handle (21 Sep) 45137 – VPOC from 21 Sep) 45222 – Selling Tail (21 Sep) 45347 – VPOC from 20 Sep 45461 – Closing PBH (20 Sep) |
| Down |
| 44488 – Buying Tail (29 Sep) 44313 – NeuX High (28 Sep) 44202 – Buying tail (27 Sep) 44139 – Ext Handle (01 Sep) 43986 – VPOC from 01 Sep 43870 – Buying Tail (01 Sep) 43735 – 1 ATR from 44182 43600 – Swing Low (16 Aug) |
