Nifty Spot: 22513 [ 22619 / 22304 ]
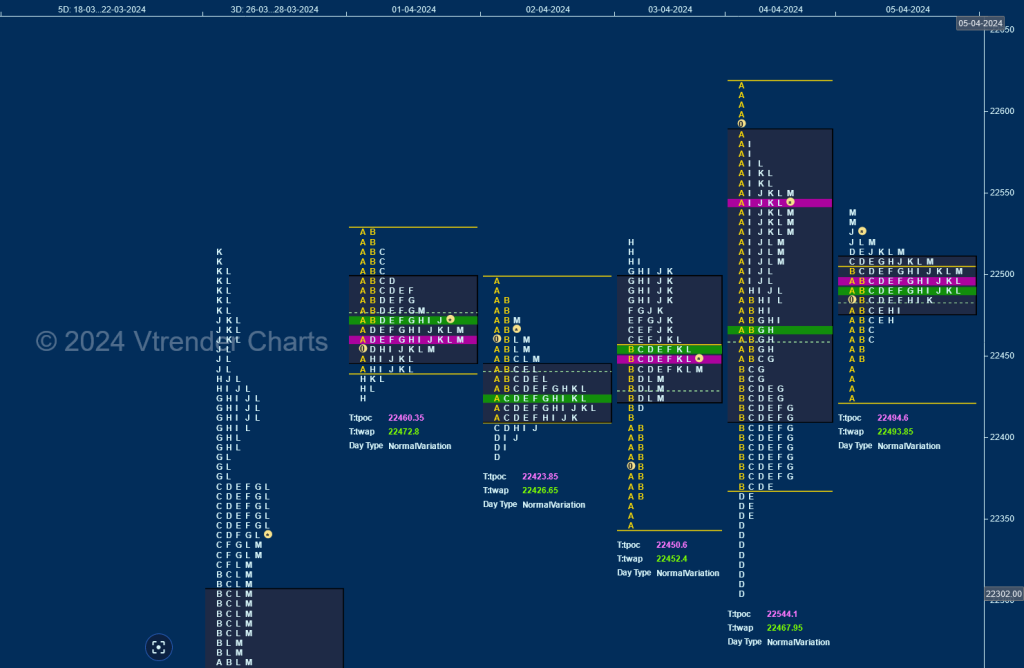
Nifty opened the week with similar highs of 22524 & 22529 in the Initial Balance on Monday and formed back to back narrow range Normal Days building prominent POCs at 22460 & 22423 and opened lower on Wednesday where it left an initiative buying tail along with an extension handle at 22408 swiping through the Value area zones of last 2 sessions as it made a high of 22521 and giving a nice 3-day composite balance with a prominent POC at 22458.
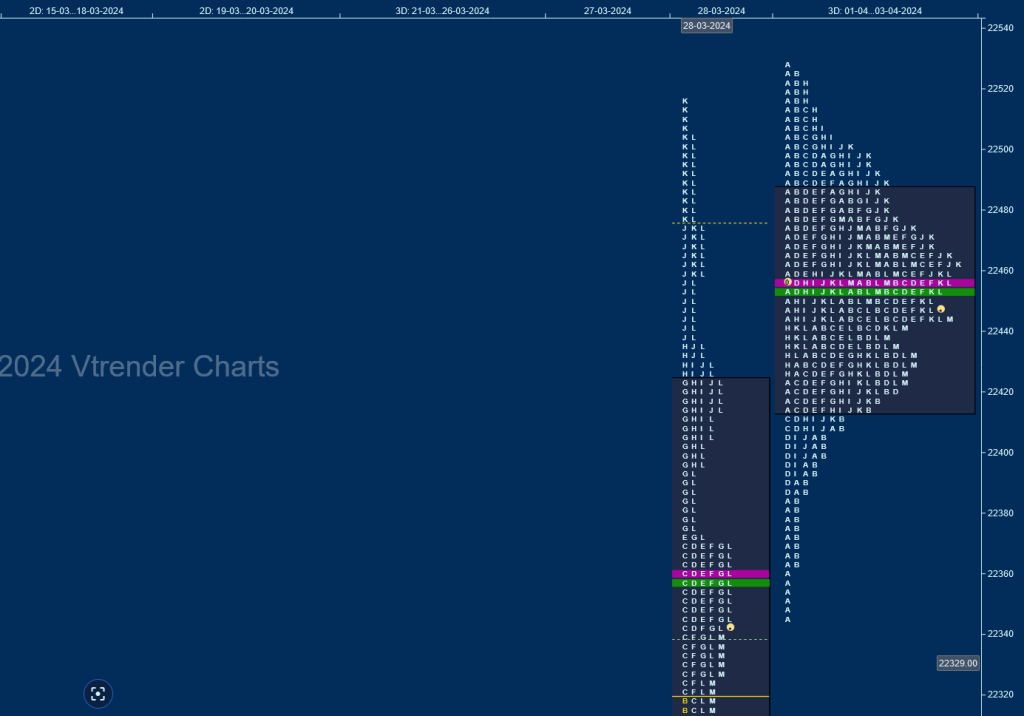
The auction then opened with a gap up on Thursday hitting new ATH of 22619 but could not sustain confirming an ORR (Open Rejection Reverse) to the downside as it not only swiped through the 3-day Value but went on to make new lows for the week at 22304 but the attempt to get into previous week’s Value was rejected marking the end of the downside triggering a sharp bounce back to 22580 as it left a rare Double Inside Day in a range of 315 points and this elongated profile led to another narrow range Normal Day on Friday where it left a small A period buying tail from 22451 to 22427 and on the upside made a mini spike from 22528 to 22537 stalling just below Thursday’s VPOC of 22544 which will be the immedite reference on the upside.
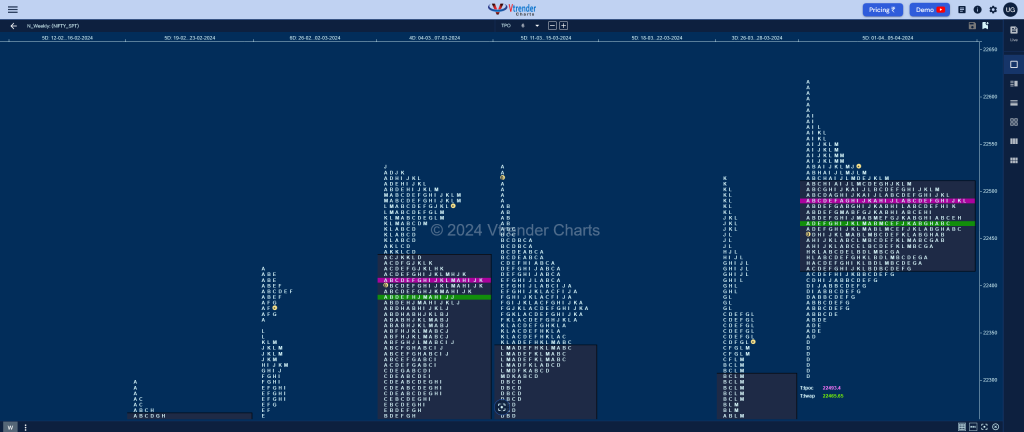
Nifty has formed a well balanced Neutral Centre week which also resembles a 3-1-3 profile with similar tails at both ends with Value completely higher at 22417-22493-22511 and has a good chance of moving away from this zone in the coming week provided one of the singles zone is taken out by initiaitve activity.
Click here to view this week’s MarketProfile of Nifty on Vtrender Charts
Hypos for 08th Apr
| Up |
| 22544 – VPOC (04 Apr) 22580 – Selling Tail (04 Apr) 22619 – ATH 22648 – 1 ATR (Buy tail 22451) 22691 – 1 ATR (POC 22494) 22725 – 1 ATR (Spike low 22528) |
| Down |
| 22528 – Spike low (05 Apr) 22493 – Weekly POC 22451 – Buying Tail (05 Apr) 22417 – Weekly VA 22350 – Buying Tail (04 Apr) 22304 – M TPO h/b (28 Mar) |
Hypos for 10th Apr
| Up |
| 22652 – M TPO high 22690 – Halfback (09 Apr) 22744 – POC (09 Apr) 22770 – 1 ATR (VPOC 22544) 22814 – Weekly ATR (22304) 22844 – Weekly 2 IB |
| Down |
| 22639 – M TPO low 22586 – Buying Tail (08 Apr) 22544 – VPOC (04 Apr) 22493 – Weekly POC 22451 – Buying Tail (05 Apr) 22417 – Weekly VAL |
Hypos for12th Apr
| Up |
| 22755 – Selling tail (10 Apr) 22814 – Weekly ATR (22304) 22844 – Weekly 2 IB 22892 – Monthly 2 IB 22956 – 1 ATR (FA 22768) 22991 – Weekly 3 IB |
| Down |
| 22727 – IBH (10 Apr) 22673 – FA (10 Apr) 22639 – M TPO low (09 Apr) 22586 – Buying Tail (08 Apr) 22544 – VPOC (04 Apr) 22493 – Weekly POC |
BankNifty Spot: 48493 [ 48557 / 47279 ]
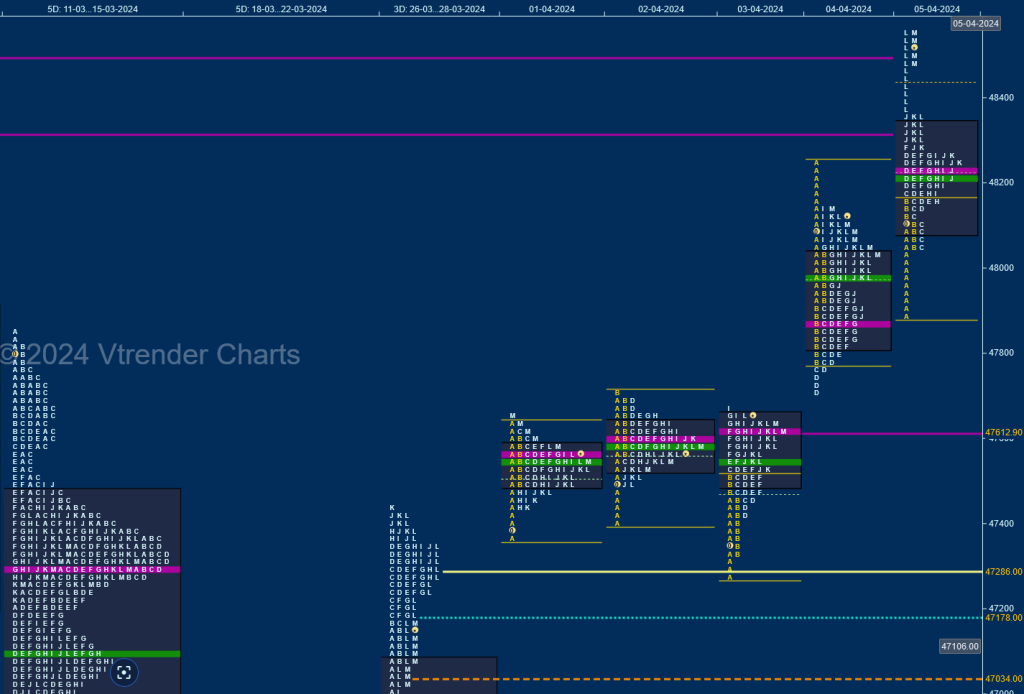
BankNifty opened higher scaling above previous week’s high of 47440 as it left small A period buying tails & made higher highs of 47646 & 47707 on Monday and Tuesday but could not put in a RE (Range Extension) triggering a drop lower in search of fresh demand as it tested the monthly POC of 47300 while making a low of 47279 on Wednesday but left yet another small but very important initative buying singles giving a move back to 47676 for the day forming a nice 3-day composite with overlapping POC around 47610.
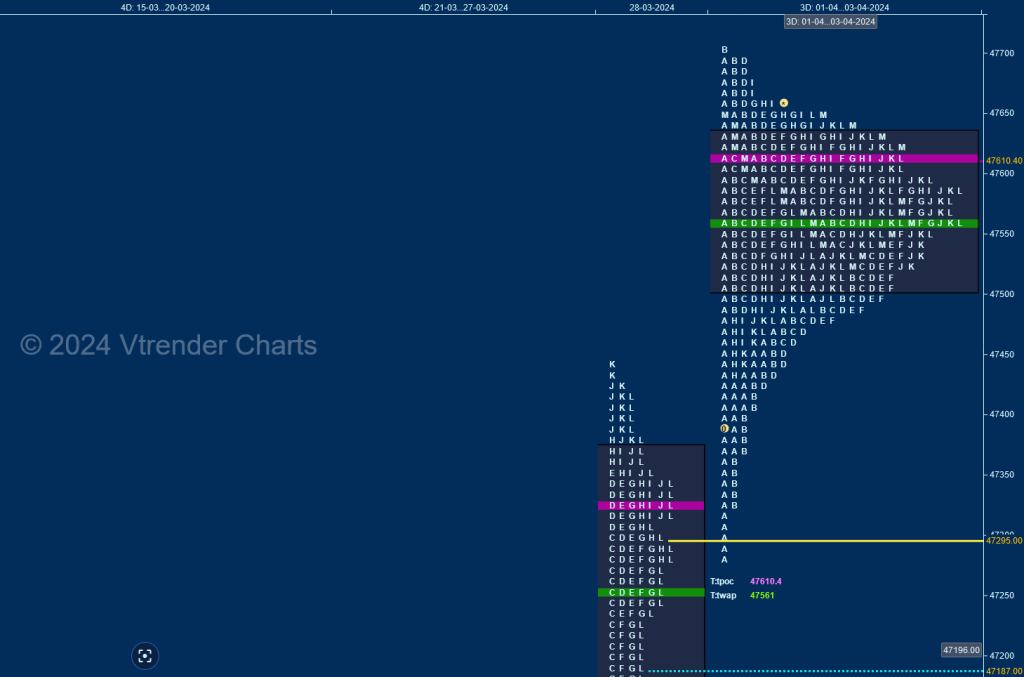
The auction then opened higher on Thursday signalling a move away from balance as it repaired the poor highs of 48155 & 48161 from 06th Mar while hitting 48254 but could not sustain resulting in a long liquidation break lower till the D TPO where it hit 47712 holding just above the daily extension handle of 47707 which confirmed that the PLR (Path of Least Resistance) was to the upside as it then completed a nice 3-1-3 profile for the day with completely higher Value.
BankNify continued the upside imbalance on Friday as it opened above previous POC of 47869 and left yet another A period buying tail which was followed by multiple REs as it first tagged the weekly VPOC of 48312 in the J TPO before giving a spike into the close completing the objective of the higher weekly VPOC of 48492 while making a high of 48557 leaving a Neutral Extreme Weekly profile with completely higher Value at 47280-47610-47901 and a spike zone from 48363 to 48557 as Spike Rules will be in play at open for the next week.
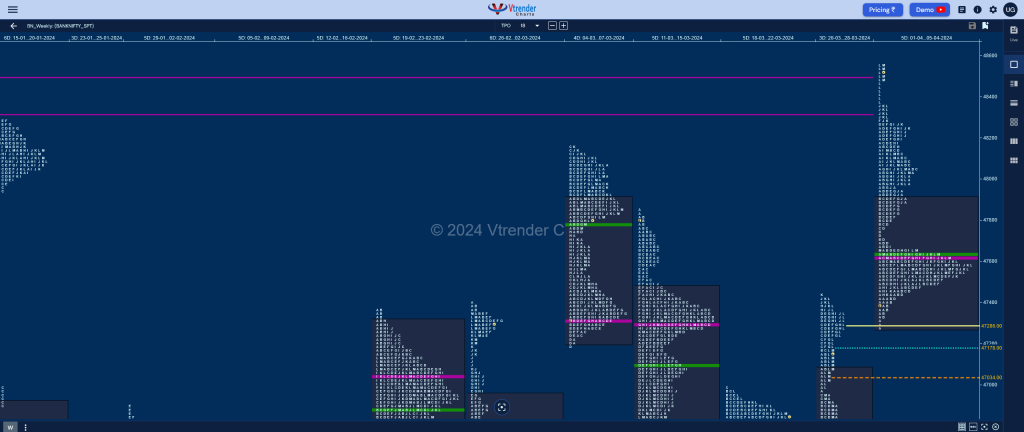
Click here to view this week’s MarketProfile of BankNifty on Vtrender Charts
Hypos for 09th Apr
| Up |
| 48492 – Weekly VPOC (26-29 Dec) 48614 – Selling tail (28 Dec) 48742 – Monthly 1.5 IB 48853 – 1 ATR (Ext handle 48363) 48974 – 1 ATR (VPOC 48492) 49093 – Weekly ATR (47610) |
| Down |
| 48480 – Cloing tail (05 Apr) 48363 – Ext Handle (05 Apr) 48222 – POC ( 05 Apr) 48116 – C TPO h/b (05 Apr) 48000 – A TPO h/b (05 Apr) 47869 – VPOC (04 Apr) |
Hypos for 10th Apr
| Up |
| 48771 – M TPO high 48880 – TPO HVN (09 Apr) 48974 – 1 ATR (VPOC 48492) 49093 – Weekly ATR (47610) 49186 – 2 ATR (VPOC 48222) 49302 – Weekly 3 IB |
| Down |
| 48668 – K TPO h/b 48559 – VPOC (08 Apr) 48442 – Buying Tail (08 Apr) 48363 – Ext Handle (05 Apr) 48222 – POC ( 05 Apr) 48116 – C TPO h/b (05 Apr) |
Hypos for12th Apr
| Up |
| 49010 – Sell tail (10 Apr) 49142 – 1 ATR (POC 48713) 49229 – Monthly 2 IB 49308 – 1 ATR (yPOC 48879) 49439 – 1 ATR (Tail 49010) 49612 – Monthly Range Tgt |
| Down |
| 48986 – 2-day VAH (09-10 Apr) 48856 – PBL (10 Apr) 48713 – POC (09 Apr) 48559 – VPOC (08 Apr) 48442 – Buying Tail (08 Apr) 48363 – Ext Handle (05 Apr) |
