Nifty Spot: 22466 [ 22502 / 21821 ]

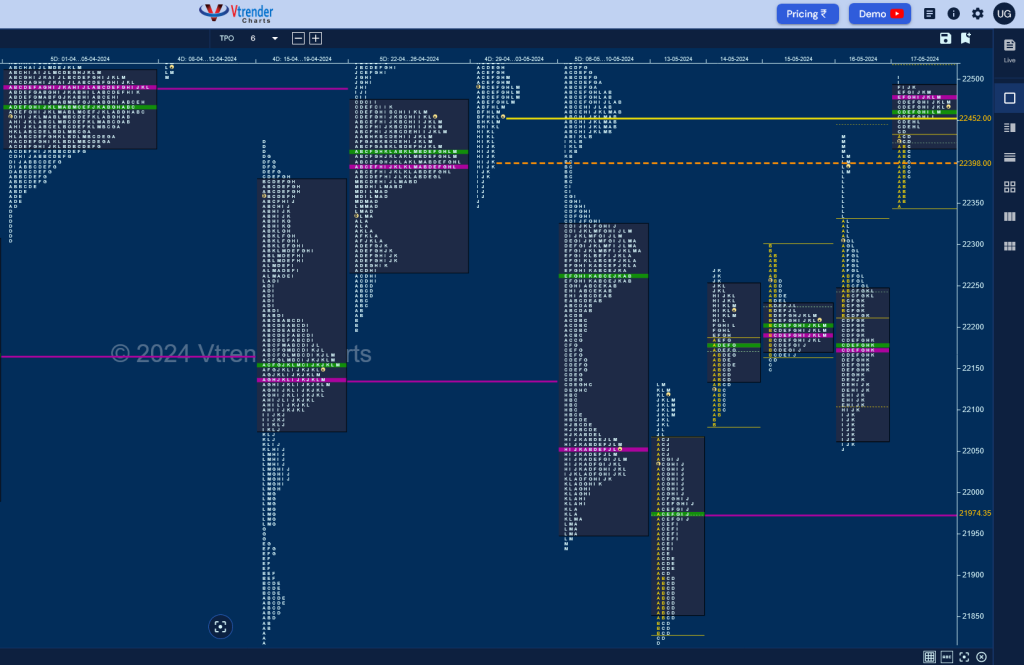
Monday – Nifty opened with a Test Drive lower from previous week’s POC of 22054 as it made new lows for the month leaving a big 239 point range Initial Balance which included an initiative selling tail from 22067 to 21897 along with a low of 21828. The auction then made couple of attempts to extend lower but could only manage marginal new lows of 21821 as the 19th Apr A TPO POC of 21824 held and the weekly buying tail (15-19 Apr) showed signs of demand coming back triggering an OTF probe higher in the second half of the day resulting in a FA (Failed Auction) being confirmed at 21821 and a Neutral Extreme (NeuX) Day Up hitting highs of 22131 into the close showing reversal of Trend
Tuesday – continued the upside probe in the A period as it tagged 22182 stalling just below the negated FA of 22185 (08th May) leading to a move lower in the B TPO where it made a low of 22081 taking support just above the NeuX zone low of 22067 indicating that the new FA of 21821 was in play for the 2 ATR target of 22292 and accordingly gave an OTF (One Time Frame) probe higher till the J period making a high of 22270
Wednesday – made a higher open and completed the objective of 22292 while making a high of 22297 almost tagging the weekly HVN of 22306 and formed a narrow range 146 point range ‘b’ shape profile confirming profit booking by the buyers with value completely inside
Thursday – saw an attempt to move away from the 2-day overlapping value to the upside getting rejected as Nifty made new weekly highs of 22330 in the A period but could sustain paving the way for 80% Rule set up as it not only swiped through last 2 days value but went on to make multiple REs (Range Extension) lower till the J TPO where it make a look down below 22067 making a low of 22054 halting right at the weekly POC which held resulting in a monster of an up move of 378 points and the second Neutral Extreme Day Up of the week with new highs of 22432
Friday – started with an OAIR testing the NeuX zone from 22330 to 22432 in the IB before the auction resumed the upside imbalance with multiple REs as it not only tagged the uppermost weekly HVN of 22446 but went on to make a high of 22502 leaving a ‘p’ shape profile for the day with a prominent POC
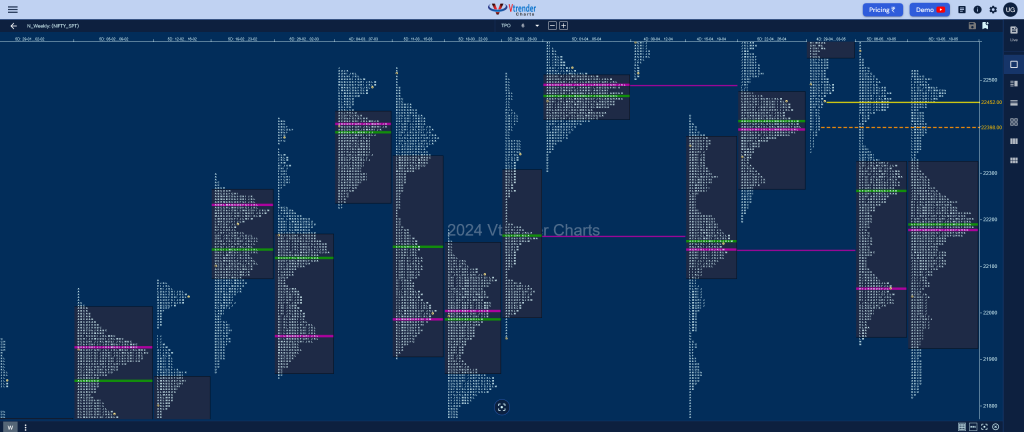
The weekly profile is a Trend Up one after confirming change of Trend with a FA at 21821 on the first day forming an elongated range of 681 points from 21821 to 22502 with completely outside Value at 21927-22177-22323 which spent most of the time filling up previous week’s low volume zone between 22054 to 22306 and gave a fresh move away to the upside building a fresh HVN higher at 22479 which will be the opening reference as well as support for the next week along the extension handle at 22330 break of which can give a drop down to 22177 whereas on the upside, Nifty will need to take out previous week’s selling tail from 22542 to 22588 for a probe towards the higher weekly VPOC of 22682 and new ATH.

Click here to view this week’s MarketProfile of Nifty on Vtrender Charts
Hypos for 21st May – 22466 [ 22432 / 22054 ]
| Up |
| 22485 – M TPO high (17 May) 22542 – Sell Tail (06 May) 22588 – Prev Week High 22644 – C TPO h/b (03 May) 22682 – Weekly VPOC |
| Down |
| 22461 – M TPO low (17 May) 22423 – 17 May Halfback 22385 – B TPO h/b (17 May) 22330 – NeuX Ext Handle (16 May) 22267 – 3-day VAH (14-16 May) |
Hypos for 22nd May – 22529 [ 22591 / 22440 ]
| Up |
| 22545 – POC (21 May) 22591 – PDH 22644 – C TPO h/b (03 May) 22682 – Weekly VPOC 22727 – B TPO h/b (03 May) |
| Down |
| 22498 – Closing PBL (21 May) 22449 – Buy Tail (21 May) 22402 – Apr VWAP 22351 – Buy Tail (17 May) 22303 – SOC (16 May) |
Hypos for 23rd May – 22597 [ 22629 / 22483 ]
| Up |
| 22611 – M TPO h/b (22 May) 22644 – C TPO h/b (03 May) 22682 – Weekly VPOC 22727 – B TPO h/b (03 May) 22754 – Ext Handle (03 May) 22794 – ATH (03 May) |
| Down |
| 22589 – 2-day VAH (21-22 May) 22545 – 2-day POC (21-22 May) 22518 – 2-day VAL (21-22 May) 22480 – D TPO h/b (21 May) 22449 – Buy Tail (21 May) 22402 – Apr VWAP |
Hypos for 24th May – 22967 [ 22993 / 22577 ]
| Up |
| 22989 – Sell tail (23 May) 23045 – 2 ATR (VPOC 22555) 23104 – 2 ATR (Prev Open 22610) 23163 – 2 ATR (yPOC 22673) 23201 – 2 ATR (M SOC 22711) |
| Down |
| 22947 – M TPO low (23 May) 22891 – Mid-profile tail (23 May) 22860 – Ext Handle (23 May) 22795 – PBL (23 May) 22733 – Ext Handle (23 May) |
BankNifty Spot: 48115 [ 48188 / 46983 ]

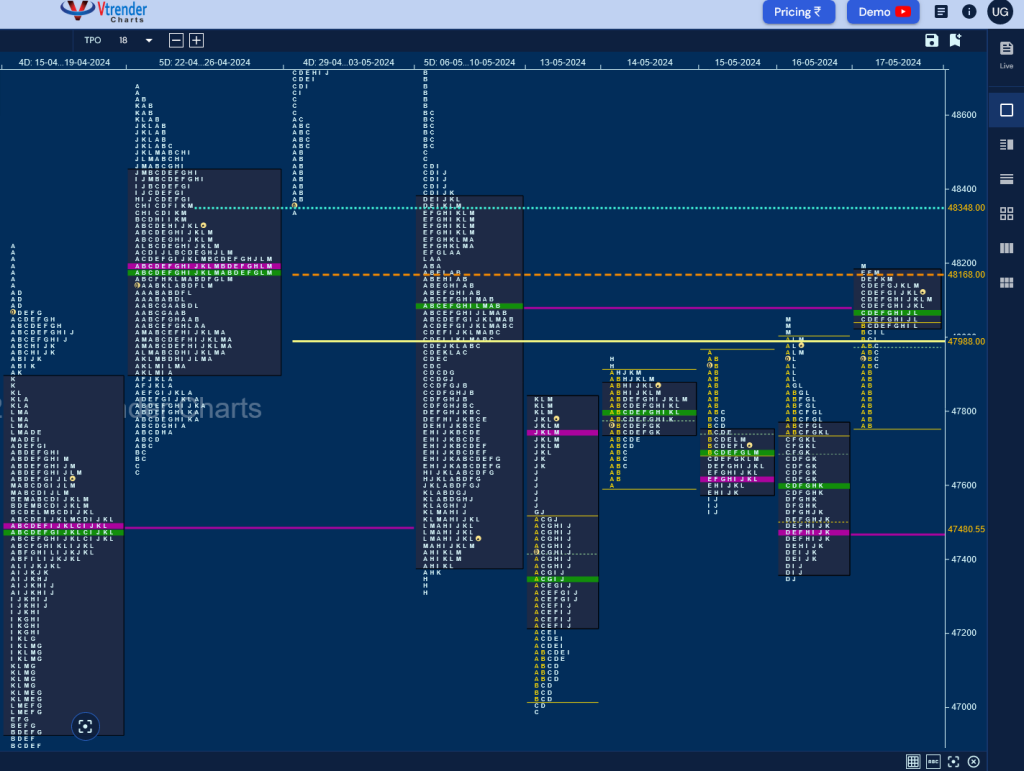
Monday – BankNifty also started with an Open Test Drive Down as it formed a big IB range of 487 points breaking below previous week’s low to hit 47021 after which it made a typical C side extension to 46983 taking support right at the monthly buying tail from April which went on to get confirmed as a FA (Failed Auction) marking a short term reversal as it left an extension handle at 47520 and went on to leave a Neutral Extreme (NeuX) Day Up with highs of 47841
Tuesday – The imbalance of previous session led to a narrow range balance being formed all day with overlapping value and a prominent POC at 47790 as it formed marginal new highs of 47937
Wednesday – saw a higher open but the auction could not take out the selling extension handle of 47965 from 09th May triggering a probe lower for a test of the 47520 zone as it formed a long liquidation ‘b’ shape profile with similar lows at 47535 and the POC at 47625
Thursday – made an unexpected gap up open with BankNifty even making a look up above 47965 but could only manage to tag 48002 and saw sellers coming back strongly leaving an ORR (Open Rejection Reverse) and a big drop down in the C & D TPOs where it made new lows for the week at 47340. The auction however seemed exhausted on the downside as it could not make any further extension and made almost similar lows of 47345 triggering a short covering bounce into the close resulting in new highs of 48053 falling just short of the weekly POC of 48087 and the second Neutral Day of the week
Friday – started with a rejection of previous day’s spike close with a move down to 47758 in the A TPO but saw the B period do a rebel getting back to 48025 after making almost similar lows of 47770 which was followed by a good C side extension to 48139 as the weekly POC was finally tagged but began to form a balance around it for the rest of the day forming a ‘p’ shape profile for the day with a mini spike higher to 48188 into the close
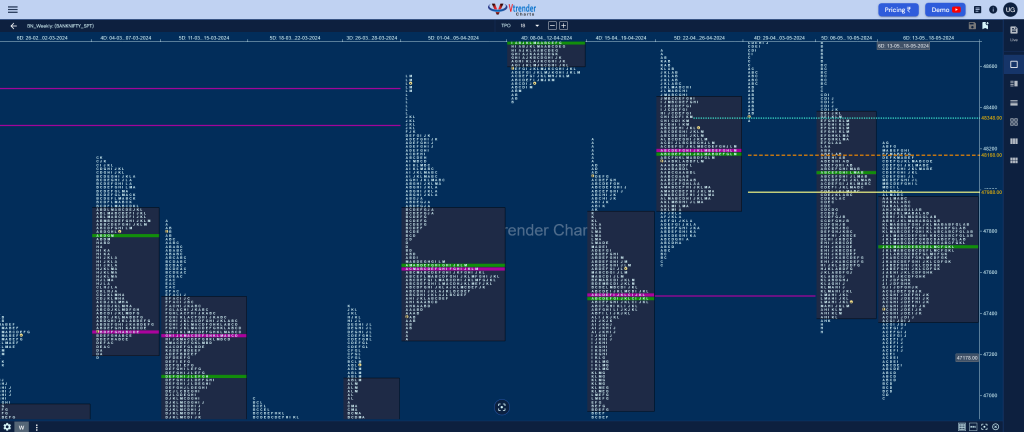
The weekly profile is a Normal Variation one to the upside in a relatively narrow range of 1205 points and has formed a nice balanced Value area filling up the lower distribution of previous week’s DD with almost completely inside previous one at 47373-47725-47966 but unlike last week has closed above the Value hence the PLR (Path of Least Resistance) would be on the upside for a test of the 2 ATR objective of 48309 from Monday’s FA of 46983 and above it prior week’s DD zone from 48465 to 48784 would be the immediate target

Click here to view this week’s MarketProfile of BankNifty on Vtrender Charts
Hypos for 21st May – 48115 [ 48188 / 47758 ]
| Up |
| 48168 – VAH (17 May) 48300 – VPOC (07 May) 48406 – J TPO h/b (07 May) 48522 – Ext Handle (07 May) 48660 – Monthly IBL |
| Down |
| 248110 – M TPO low (17 May) 48003 – PBL (17 May) 47897 – B TPO h/b (17 May) 47740 – 3-day HVN (14-16 May) 47588 – 3-day VAL (14-16 May) |
Hypos for 22nd May – 48048 [ 48259 / 47961 ]
| Up |
| 48142 – POC (21 May) 48260 – Monthly DD zone 48406 – J TPO h/b (07 May) 48522 – Ext Handle (07 May) 48660 – Monthly IBL |
| Down |
| 47994 – IBL (21 May) 47897 – B TPO h/b (17 May) 47740 – 3-day HVN (14-16 May) 47588 – 3-day VAL (14-16 May) 47480 – VPOC (16 May) |
Hypos for 23rd May – 47781 [ 48114 / 47435 ]
| Up |
| 47805 – VAH (22 May) 47959 – Sell Tail (22 May) 48142 – VPOC (21 May) 48259 – Monthly DD zone 48406 – J TPO h/b (07 May) |
| Down |
| 47772 – 22 May Halfback 47625 – Buy tail (22 May) 47480 – VPOC (16 May) 47345 – Buy tail (16 May) 47220 – PBL (13 May) |
Hypos for 24th May – 48768 [ 48829 / 47873 ]
| Up |
| 48788 – M TPO h/b (23 May) 48911 – Sell Tail (07 May) 49091 – VAH (06 May) 49231 – Sell Tail (06 May) 49358 – B TPO h/b (03 May) |
| Down |
| 48717 – L TPO h/b (23 May) 48540 – POC (23 May) 48406 – Ext Handle (23 May) 48259 – Weekly IBH 48139 – B TPO h/b (23 May) |
