Nifty Spot: 23290 [ 23338 / 21281 ]

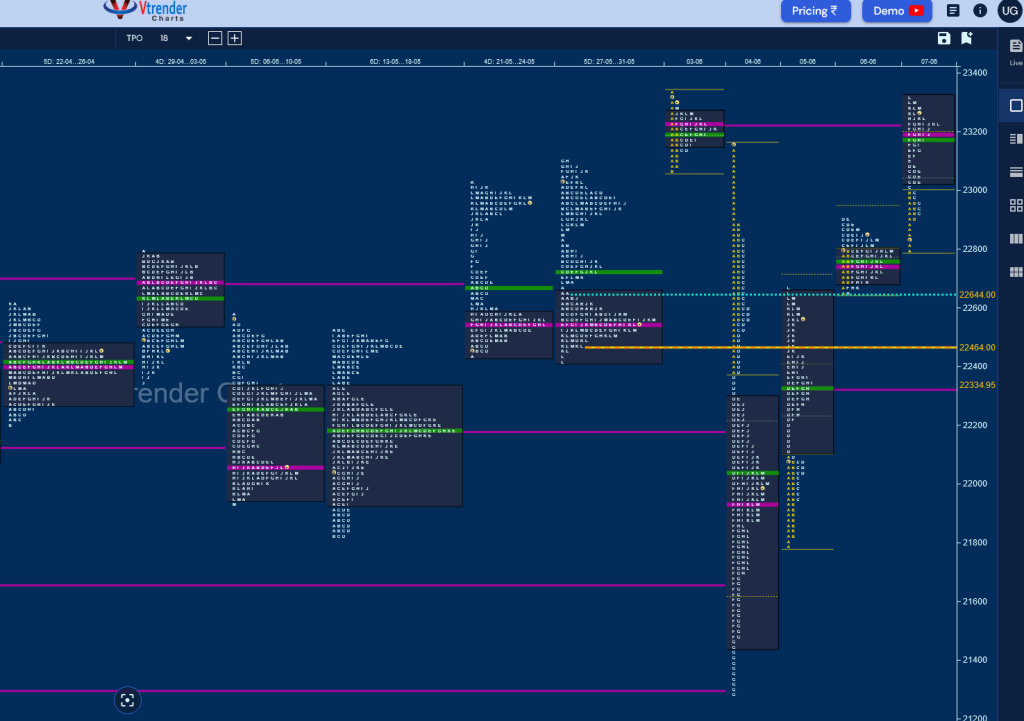
Monday – 23264 [ 23338 / 23062 ] Nifty opened the week with a huge gap up of 807 points recording new ATH of 23338 but settled down into an OAOR forming a Normal Day and a nice Gaussian Curve with a prominent POC at 23229 while taking support at 23062
Tuesday – 21884 [ 23169 / 21281 ] saw an open Drive Down from Monday’s Value as the auction not only made an OH start at 23179 but dropped by 770 points swiping through previous week’s range in the A period itself and after taking a pause resumed the fall from the D period onwards making gigantic extensions till the G period tagging the 3 weekly VPOCs of 22177, 21665 & 21300 while making a low of 21281 completing an unprecedented 1898 point drop in just half a day but finally showed signs of responsive buying as it left a tail till 21481 and a bounce back to 22271 before closing around the POC of 21929
Wednesday – 22620 [ 22670 / 21791 ] started with an OAIR start and continuation of a balance around 21929 in the IB after which buyers asserted control with an extension handle at 22131 in the D TPO and went on to form a Trend Day Up taking it back to the RO point of 22645 while tagging 22670
Thursday – 22821 [ 22910 / 22642 ] The auction took support at the RO point leaving poor lows of 22642 & 22645 but stalled at the entry into the A period tail from Tuesday assembling similar highs of 22904 & 22910 putting in place a nice Gaussian Curve with a prominent POC at 22745
Friday – 23290 [ 23320 / 22789 ] Nifty made an ORR start signalling a move away from previous balance as it left an initiative buying tail from 22904 to 22789 and not only negated Tuesday’s selling singles with the help of multiple REs but went on to complete the 80% Rule in Monday’s Value tagging the VPOC of 23229 while making a high of 23320 halting just below the ATH of 23338 moulding another Trend Day Up with the POC at 23199
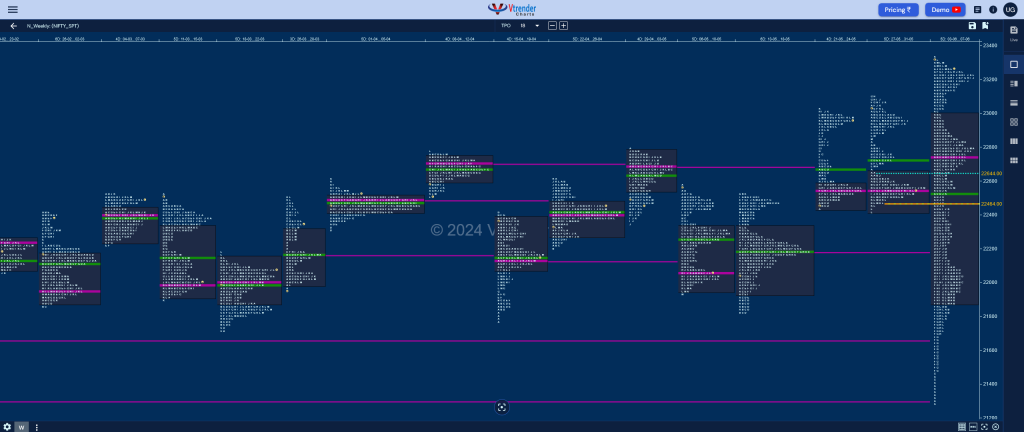
Nifty has formed an elongated 2057 point range weekly profile which was a Trend One to the downside but has retraced the entire drop it had made to close around the new ATH of 23338 forming an outside bar both in terms of range & value which was at 21885-22745-22995 with a HVN at 23200 which will act as the immediate support for the coming week staying above which it can continue to probe higher towards 23588 as the first objective whereas on the downside, below 23199 the next support will be a 23054 and a break of which could trigger a drop to the weekly POC of 22745 & RO point of 22645 in the coming week.

Click here to view this week’s MarketProfile of Nifty on Vtrender Charts
Hypos for 10th June – 23290 ( 23320 / 22789) – Trend Day
| Up |
| 23338 – Swing High (03 Jun) 23386 – 2 ATR (RO 22645) 23443 – 1 ATR (07 Jun h/b 23054) 23520 – Monthly ATR (22481) 23588 – 1 ATR (yPOC 23199) |
| Down |
| 23260 – M TPO low (07 Jun) 23199 – POC (07 Jun) 23124 – E singles (07 Jun) 23054 – 07 Jun H/B 22987 – C TPO h/b (07 Jun) |
Hypos for 11th June – 23259 ( 23412 / 23227 ) – Normal Day
| Up |
| 23264 – M TPO high (10 Jun) 23335 – POC (10 Jun) 23394 – IB Tail mid (10 Jun) 23445 – 1 ATR (07 Jun h/b 23054) 23520 – Monthly ATR (22481) 23590 – 1 ATR (yPOC 23199) |
| Down |
| 23246 – M TPO h/b 23199 – VPOC (07 Jun) 23124 – E singles (07 Jun) 23054 – 07 Jun H/B 22987 – C TPO h/b (07 Jun) 22904 – Buy Tail (07 Jun) |
Hypos for 12th June – 23264 ( 23389 / 23206 ) – Normal Variation
| Up |
| 23288 – 2-day VAL (10-11 Jun) 23332 – 2-day POC (10-11 Jun) 23380 – 2-day VAH (10-11 Jun) 23447 – 1 ATR (07 Jun h/b 23054) 23520 – Monthly ATR (22481) 23592 – 1 ATR (yPOC 23199) |
| Down |
| 23250 – M TPO h/b 23199 – VPOC (07 Jun) 23124 – E singles (07 Jun) 23054 – 07 Jun H/B 22987 – C TPO h/b (07 Jun) 22904 – Buy Tail (07 Jun) |
Hypos for 13th June – 23323 ( 23442 / 23295 ) – Normal
| Up |
| 23365 – SOC (12 Jun) 23411 – POC (12 Jun) 23447 – 1 ATR (07 Jun h/b 23054) 23520 – Monthly ATR (22481) 23592 – 1 ATR (yPOC 23199) |
| Down |
| 23297 – Buy tail (12 Jun) 23250 – M TPO h/b (11 Jun) 23199 – VPOC (07 Jun) 23124 – E singles (07 Jun) 23054 – 07 Jun H/B |
Hypos for 14th June – 23399 ( 23481 / 23354 ) – Normal (‘b’ shape)
| Up |
| 23408 – VAH (13 Jun) 23451 – IB tail mid (13 Jun) 23520 – Monthly ATR (22481) 23591 – Weekly 2 IB 23662 – 1 ATR (2D_VAL 23288) |
| Down |
| 23379 – VAL (13 Jun) 23314 – M TPO h/b (12 Jun) 23250 – M TPO h/b (11 Jun) 23199 – VPOC (07 Jun) 23124 – E singles (07 Jun) |
BankNifty Spot: 49803 [ 51133 / 46077 ]

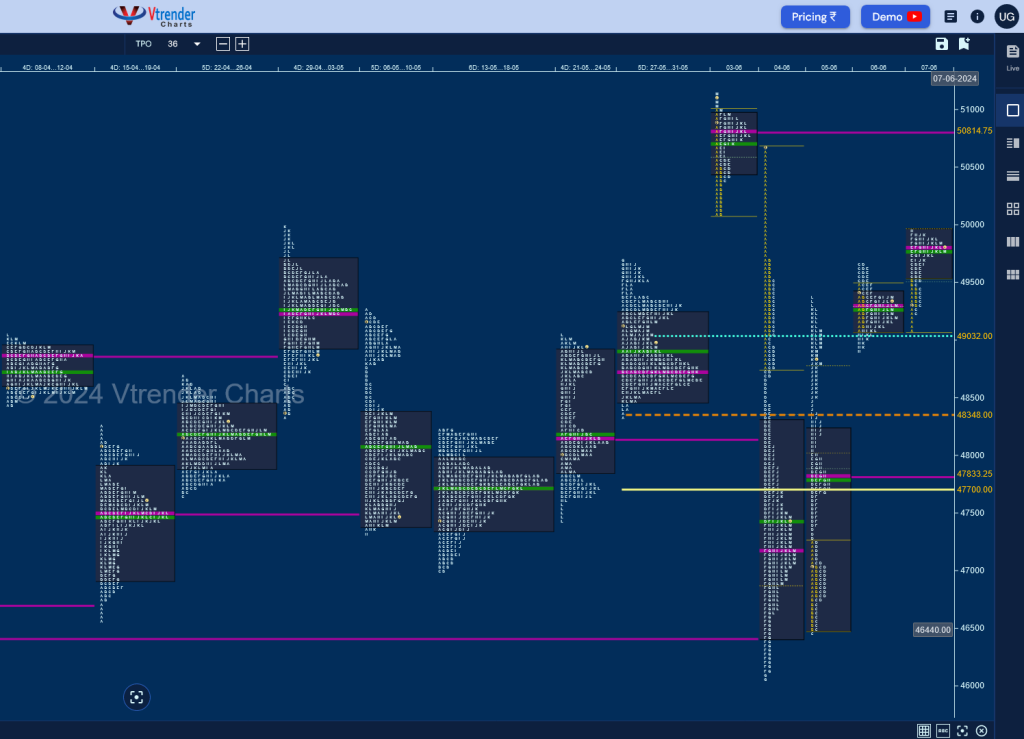
Monday – 50980 [ 51133 / 50092 ] – Normal Day
Tuesday – 46928 [ 50667 / 46077 ] – Trend Day
Wednesday – 49054 [ 49362 / 46446 ] – Neutral Extreme
Thursday – 49291 [ 49672 / 48906 ] – Neutral Centre
Friday – 49803 [ 49945 / 49080 ] – Double Distribution
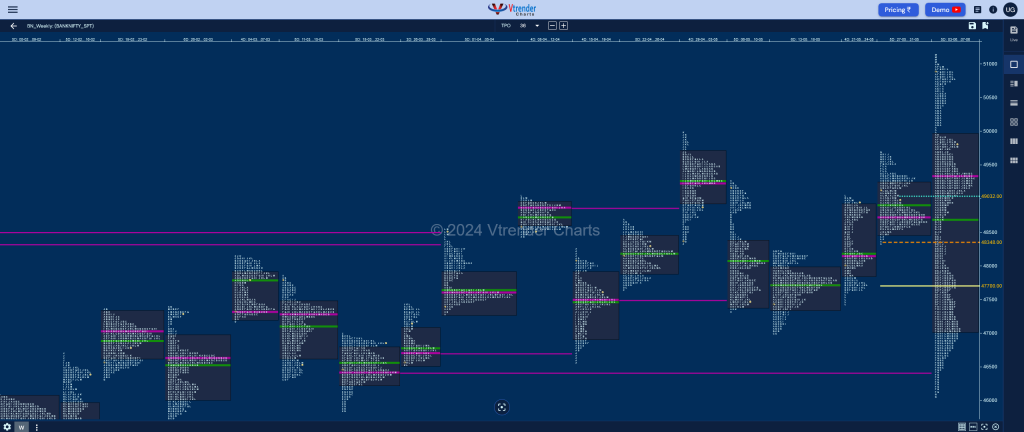
The weekly profile is a Neutral Centre one in a range of 5055 points which started with a huge gap up of 1905 points and closed in a spike higher to new ATH of 51133 on Monday which however got rejected confriming a weekly FA at top and a gigantic drop lower to 46077 on Tuesday showing some signs of rejection at the weekly VPOC of 46422 which was further confirmed as a zone of support as BankNifty confirmed a FA at 46446 and continued to probe higher for the rest of the week making a high of 49945 on Friday stalling in the big initiative selling tail of Tuesday leaving an outside bar both in terms of range & value which was at 47038-49326-49937 and will need need to take out the extension handle of 50092 for a probe towards the VPOC of 50814 and challenge the ATH in the coming week.

Click here to view this week’s MarketProfile of BankNifty on Vtrender Charts
Hypos for 10th Jun – 49803 [ 49943 / 49080 ] – Double Distribution
| Up |
| 49932 – Sell tail (07 Jun) 50092 – Ext Handle (04 Jun) 50339 – IB tail mid (04 Jun) 50490 – D TPO h/b (03 Jun) 50667 – Sell tail top (04 Jun) 50814 – VPOC (04 Jun) |
| Down |
| 49810 – POC (07 Jun) 49665 – PBL (07 Jun) 49506 – Ext Handle (07 Jun) 49228 – Buy Tail (07 Jun) 49047 – RO point 48800 – Ext Handle (05 Jun) |
Hypos for 11th Jun – 49780 [ 50253 / 49622 ] – Normal Day
| Up |
| 49791 – VAL (10 Jun) 49939 – 10 Jun H/B 50099 – Sell Tail (10 Jun) 50253 – Weekly IBH 50490 – D TPO h/b (03 Jun) 50667 – Sell tail top (04 Jun) |
| Down |
| 49727 – M TPO h/b (10 Jun) 49513 – 07 Jun H/B 49355 – Weekly 1.5 IB 49193 – L TPO h/b (06 Jun) 49047 – RO point 48800 – Ext Handle (05 Jun) |
Hypos for 12th Jun – 49705 [ 49970 / 49530 ] – Normal Day
| Up |
| 49767 – 2-day VAL (10-11 Jun) 49960 – 2-day VAH (10-11 Jun) 50099 – Sell Tail (10 Jun) 50253 – Weekly IBH 50490 – D TPO h/b (03 Jun) 50667 – Sell tail top (04 Jun) |
| Down |
| 49678 – M TPO h/b (11 Jun) 49513 – 07 Jun H/B 49355 – Weekly 1.5 IB 49193 – L TPO h/b (06 Jun) 49047 – RO point 48800 – Ext Handle (05 Jun) |
Hypos for 13th Jun – 49895 [ 50233 / 49697 ] – Normal Day
| Up |
| 49965 – 12 Jun H/B 50099 – SOC (12 Jun) 50253 – Weekly IBH 50490 – D TPO h/b (03 Jun) 50667 – Sell tail top (04 Jun) 50814 – VPOC (04 Jun) |
| Down |
| 49866 – 3-day POC (10-12 Jun) 49763 – 3-day VAL (10-12 Jun) 49678 – M TPO h/b (11 Jun) 49513 – 07 Jun H/B 49355 – Weekly 1.5 IB 49193 – L TPO h/b (06 Jun) |
Hypos for 14th Jun – 49846 [ 50186 / 49799 ] – Normal Day (Inside Bar)
| Up |
| 49862 – Jun POC 50014 – 4-day VAH (10-13 Jun) 50129 – IB tail mid (13 Jun) 50253 – Weekly IBH 50490 – D TPO h/b (03 Jun) 50667 – Sell tail top (04 Jun) |
| Down |
| 49775 – 4-day VAL (10-13 Jun) 49678 – M TPO h/b (11 Jun) 49513 – 07 Jun H/B 49355 – Weekly 1.5 IB 49193 – L TPO h/b (06 Jun) 49047 – RO point |
