Nifty Spot: 23465 [ 23490 / 23206 ]

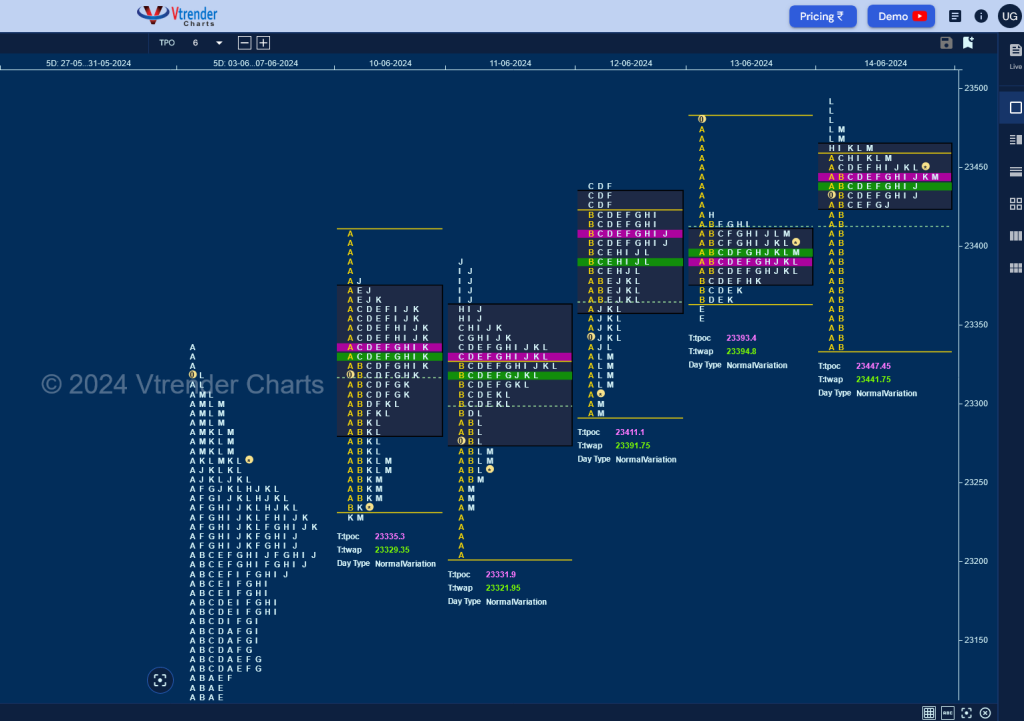
Monday – 23259 ( 23411 / 23227 ) – Normal Day [Nifty opened the week with a huge gap up of 807 points recording new ATH of 23338 but settled down into an OAOR forming a Normal Day and a nice Gaussian Curve with a prominent POC at 23229 while taking support at 23062]
Tuesday – 23264 [ 23389 / 23206 ] – Normal Variation [The auction carried on the downside imbalance at open where it made new lows for the week at 23206 taking support right above the weekly HVN of 23200 and left an opposing A period buying tail signalling the return of demand as it went on to test Monday’s selling singles but could only manage to tag 23389 triggering a probe down back into the A singles while making a low of 23232]
Wednesday – 23323 [ 23411 / 23295 ] – Normal [started with a move away from the 2-day overlapping POC of 23332 as it left another A period buying tail from 23368 to 23295 and went on to make new ATH of 23420 in the B but made the dreaded C side extension to 23438 which was followed by similar highs of 23441 in the D TPO signalling exhaustion resulting in yet another sell off in the second half making it a hat-trick for the week as it tagged 23297 into the close taking support just above the 2-day VAL of 23288]
Thursday – 23399 [ 23481 / 23354 ] – Normal (‘b’ shape) [The auction took support at the RO point leaving poor lows of 22642 & 22645 but stalled at the entry into the A period tail from Tuesday assembling similar highs of 22904 & 22910 putting in place a nice Gaussian Curve with a prominent POC at 22745]
Friday – 23465 [ 23490 / 23334 ] – Normal (‘p’ shape) [Nifty opened in Thursday’s selling singles and got rejected leading to a probe below previous lows as it hit 23334 taking support right above the developing weekly / monthly POC of 23332 and more confirmation of buyers holding came in form of similar lows of 23338 in the B TPO as the auction swiped back through previous value leaving a halfback at the yPOC of 23393 and formed value in Thursday’s selling tail for rest of the day forming a ‘p’ shape profile for the day building a prominent POC at 23447 before it made an attempt to spike higher in the L where it recorded new highs of 23490 but could not sustain and closed right at the POC]
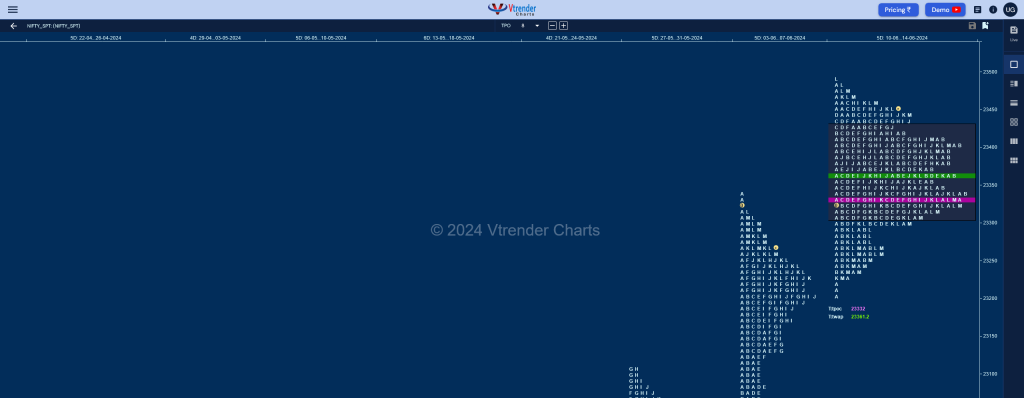
The weekly profile is a well balanced one inspite of being a Neutral Extreme thanks to the dual auction seen on all days which kept the range in a narrow 284 points & took support just above previous week’s HVN of 23200 leaving a FA (Failed Auction) on the higher timeframe and has formed completely higher Value at 23308-23332-23424 with a close above value so looks good for the upside to continue in the coming week towards the objective of 23827 with immediate support at 23412 and swing one at 23332

Click here to view this week’s MarketProfile of Nifty on Vtrender Charts
Hypos for 17th June – 23465 [ 23490 / 23334 ] – Normal
| Up |
| holiday |
| Down |
| holiday |
Hypos for 18th June – 23465 [ 23490 / 23334 ] – Normal
| Up |
| 23472 – Sell tail (14 Jun) 23520 – Monthly ATR (22481) 23582 – 1 ATR (Swing Low 23206) 23664 – 1 ATR (2D_VAL 23288) 23714 – 1 ATR (Buy tail 23338) |
| Down |
| 23444 – PBL (14 Jun) 23393 – SOC (14 Jun) 23338 – Buy Tail (14 Jun) 23288 – 2-day VAL (10-11 Jun) 23250 – M TPO h/b (11 Jun) |
Hypos for 19th June – 23558 [ 23579 / 23499 ] Normal
| Up |
| 23573 – Sell tail (Low 23206) 23619 – Weekly 1.5 IB 23659 – 1 ATR (2D_VAL 23288) 23704 – 1 ATR (Buy tail 23338) 23759 – 1 ATR (SOC 23393) |
| Down |
| 23549 – VAH (18 Jun) 23488 – IB tail mid (18 Jun) 23447 – VPOC (14 Jun) 23393 – SOC (14 Jun) 23338 – Buy Tail (14 Jun) |
Hypos for 20th June – 23516 [ 23664 / 23413 ] Neutral
| Up |
| 23538 – 19 Jun Halfback 23593 – VAH (19 Jun) 23664 – FA (19 Jun) 23711 – 1 ATR (Buy tail 23338) 23766 – 1 ATR (SOC 23393) 23827 – Weekly ATR (FA 23206) |
| Down |
| 23503 – VAL (19 Jun) 23435 – Buy tail (19 Jun) 23393 – SOC (14 Jun) 23338 – Buy Tail (14 Jun) 23288 – 2-day VAL (10-11 Jun) 23199 – VPOC (07 Jun) |
Hypos for 21st June – 23567 [ 23624 / 23442 ] Normal Variation
| Up |
| 23576 – 3-day VAH (18-20 Jun) 23612 – Sell tail (20 Jun) 23664 – FA (19 Jun) 23714 – 1 ATR (Buy tail 23338) 23769 – 1 ATR (SOC 23393) 23827 – Weekly ATR (FA 23206) |
| Down |
| 23538 – 3-day POC (18-20 Jun) 23461 – Buy tail (20 Jun) 23412 – 14 Jun Halfback 23379 – SOC (14 Jun) 23338 – Buy Tail (14 Jun) 23288 – 2-day VAL (10-11 Jun) |
BankNifty Spot: 51398 [ 51957 / 50441 ]

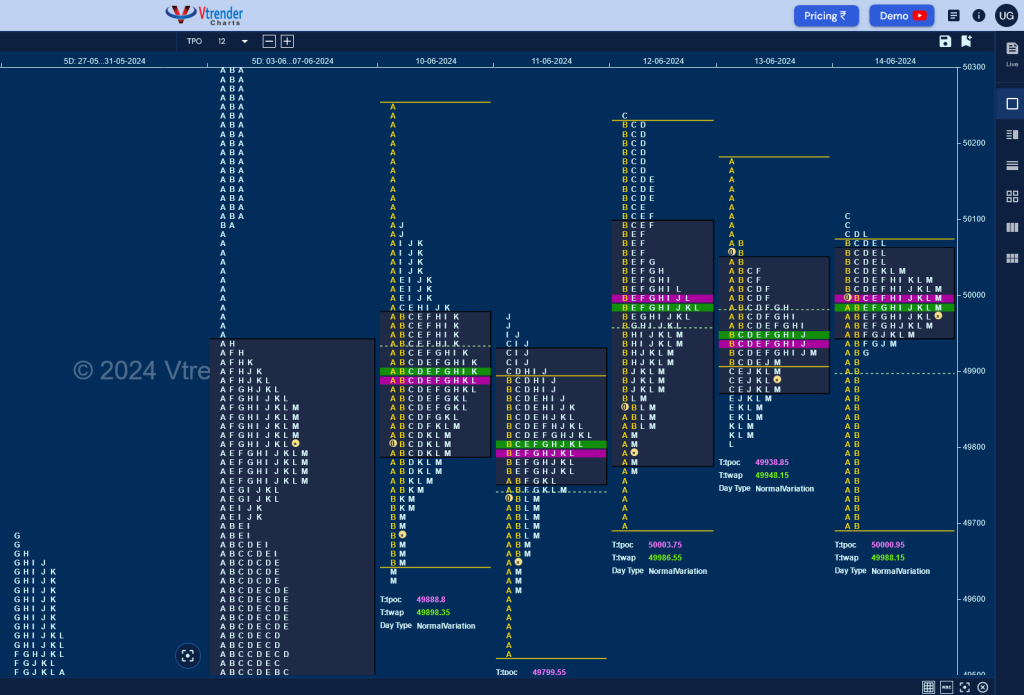
Monday – 49780 [ 50253 / 49622 ] – Normal Day [BankNifty opened with a swipe higher to 50253 but was swiftly rejected from the extension handle of 500929 leaving an A period selling tail as it went on to get back in previous week’s Value making a low of 46954 in the IB where it saw some demand coming back resulting in another probe higher to 50092 but could only manage to tag 50099 leaving a PBH and paving way for a probe lower into the close as it formed a ‘b’ shape profile for the day with a prominent POC at 49888 marking marginal new lows of 49622]
Tuesday – 49705 [ 49970 / 49530 ] – Normal Day [The auction continued the closing imbalance by making a look down below Monday’s low recording new lows for the week at 49530 but left an A period buying tail and completed the 80% Rule in previous value to the dot as it made a high of 49970 forming a ‘p’ shape profile with a nice 3-1-3 profile on the 2-day composite with a prominent POC at 49867]
Wednesday – 49895 [ 50233 / 49697 ] – Normal Day [BankNifty opened around the 2-day POC and made an attempt to probe lower but could not sustain leaving an A period buying tail and a move back into the 2-day balance not only completing the 80% Rule but almost negating the entire A period selling tail from Monday as it made a high of 50222 in the B TPO which was followed by the dreaded C side extension to 50233 and the inability by the buyers to get above Monday’s high brought back some supply and for the third day running resulted in a long liquidation drop lower in the second half of the day as it completed the reverse 80% Rule while making a low of 49772 into the close forming a 3-day Gaussian Curve with value at 49673-49866-50015]
Thursday – 49846 [ 50186 / 49799 ] – Normal Variation [saw a higher open which stalled right at Wednesday’s D TPO halfback of 50178 as the auction went on to leave an A period selling tail till 50073 getting back into the 3-day Value triggering the 80% Rule and promptly tagged the 3-day POC of 49866 while making a low of 49799 leaving a ‘b shape profile for the day with completely inside range & value smoothening the balance even further to a 4-day one with value at 49775-49938-50013]
Friday – 50002 [ 50102 / 49693 ] – Normal Day [For the second day in succession, the higher open got sold into as BankNifty made a look down below the VAL of 49775 and negated Wednesday’s buying tail taking support right there while making a low of 49693 in the A period but saw demand coming back as the B TPO did a rebel swiping through the composite Value and completing the 80% Rule making a high of 50070 in the process but then for the second time in the week, a typical C side extension to 50102 marked the highs for the day as the auction got into coil mode for the rest of the day building a ‘p’ shape profile with a prominent POC at 50001 where it eventually closed]
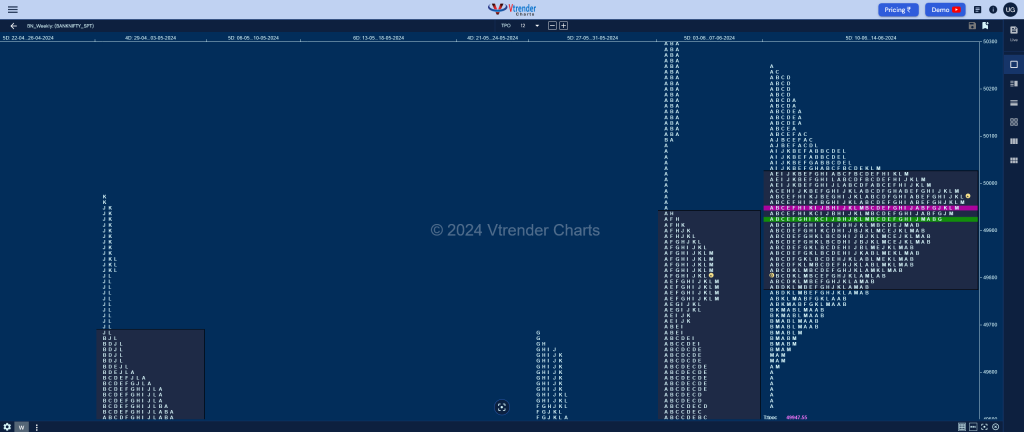
The weekly profile is a well-balanced Gaussian Curve & a Normal profile in a narrow range of just 723 points which is half the average with overlapping to higher Value at 49787-49947-50028 so has a good chance of a move away from here in the coming week with the upside objective being the responsive selling tail from 50990 to 51133 from the first week of June whereas on the downside, 49615 will be the immediate support on watch and a break of which could facilitate a probe towards the weekly VPOC of 49325 and the RO point of 49047.

Click here to view this week’s MarketProfile of BankNifty on Vtrender Charts
Hypos for 17th June – 50002 [ 50102 / 49693 ] – Normal
| Up |
| holiday |
| Down |
| holiday |
Hypos for 18th June – 50002 [ 50102 / 49693 ] – Normal
| Up |
| 50028 – Weekly VAH 50233 – Weekly Sell tail 50365 – 1 ATR (WVPOC 49326) 50490 – D TPO h/b (03 Jun) 50667 – Sell tail top (04 Jun) 50814 – VPOC (04 Jun) |
| Down |
| 49947 – Weekly POC 49787 – Weekly VAL 49615 – Weekly Buy tail 49513 – 07 Jun H/B 49326 – Weekly VPOC (03-06 Jun) 49193 – L TPO h/b (06 Jun) |
Hypos for 19th June – 50441 [ 50562 / 49900 ] Trend Day
| Up |
| 50495 – M TPO h/b 50667 – Sell tail top (04 Jun) 50814 – VPOC (04 Jun) 50990 – Weekly Sell tail (03-07 Jun) 51133 – ATH 51272 – 1 ATR (18 Jun h/b 50231) |
| Down |
| 50425 – Weekly IBH 50265 – Ext Handle (18 Jun) 50068 – Buy Tail (18 Jun) 49900 – Weekly IBL 49787 – Weekly VAL 49615 – Weekly Buy tail |
Hypos for 20th June – 51398 [ 51957 / 50441 ] Trend Day
| Up |
| 51400 – M TPO H/B (19-Jun) 51558 – L TPO H/B (19-Jun) 51725 – SOC (19-Jun) 51884 – Sell tail (19 Jun) 52039 52222 |
| Down |
| 51370 – VAH (19 Jun) 51203 – 19 Jun H/B 51031 – PBL (19 Jun) 50849 – SOC (19 Jun) 50709 – A TPO h/b (19 Jun) 50594 – Buy Tail (19 Jun) |
Hypos for 21st June – 51783 [ 51842 / 51281 ] Neutral
| Up |
| 51798 – IBH (20 Jun) 51884 – Sell tail (19 Jun) 52058 – 1 ATR (SOC 50951) 52243 – 1 ATR (VPOC 51136) 52392 – 1 ATR (FA 51281) 52525 – 2 ATR (VPOC 50311) |
| Down |
| 51730 – L TPO h/b 51561 – 20 Jun Halfback 51404 – C TPO h/b (20 Jun) 51281 – FA (20 Jun) 51136 – VPOC (19 Jun) 51031 – PBL (19 Jun) |
