Nifty Spot: 24541 [ 24564 / 24099 ] Neutral Extreme (Up)
Previous week’s report ended with this ‘The weekly profile is also a well balanced Normal one but has an initiative selling tail from 24409 to 24696 due to the gap down open and has formed completely lower Value at 24138-24229-24379 with a close near the VAH so will be interesting to watch how the auction shapes up in the coming sessions with the weekly VPOC of 24459 being the upside reference above 24409 whereas on the downside, 24284 will be the important support level on watch‘

Monday – 24347 [ 24472 / 24212 ] – Normal Variation (Up)
Tuesday – 24139 [ 24360 / 24116 ] – Trend (Down)
Wednesday – 24143 [ 24196 / 24099 ] – Normal (Gaussian)
Thursday – Holiday
Friday – 24541 [ 24564 / 24204 ] – Neutral Extreme (Up)
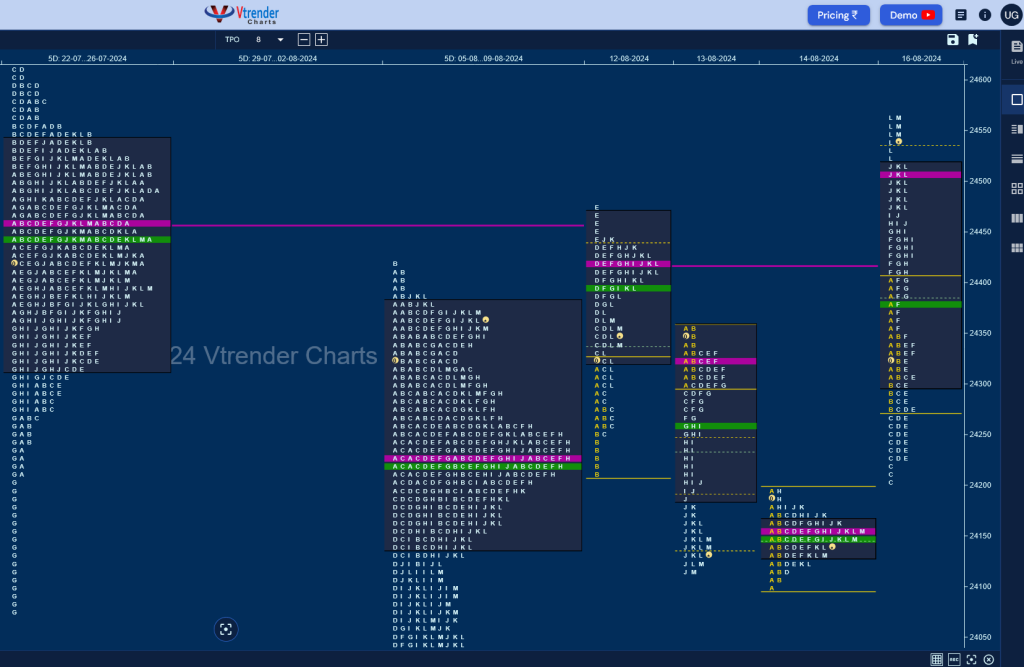
Nifty opened weak on Monday and went on to test previous week’s POC of 24229 while making a low of 24192 in the Initial Balance (IB) where it left a buying tail and reversed the probe to the upside even making multiple Range Extensions (RE) scaling above previous week’s value and tagging the weekly VPOC of 24459 (22-26 Jul) but could not sustain marking the end of the upmove leaving a responsive selling tail and getting back into previous week’s value triggering the 80% Rule which it duly completed with a Trend Day Down on Tuesday after breaking below the POC of 24229 effectively and forming similar lows of 24116 & 24119.
The poor lows got repaired with a probe to 24099 on Wednesday but the auction formed a narrow 97 point range Gaussian Curve showing poor trade facilitation to the downside though it left similar highs at 24196 & 24192 before closing around the prominent POC of 24150 and made a higher open on Friday but stopped just below Monday’s VPOC of 24421 as sellers came back to drive it down to 24274 in the IB followed by a good C side extension to 24203 where it took support just above previous high indicating that the downside was done resulting in a trending move higher from the E TPO into the close as Nifty left an extension handle right at 24459 followed by another one at 24518 as it went on to tag the Weekly Initiative Selling tail mid point of 24552 (05-08 Aug) while making a high of 24564 leaving a Neutral Extreme (NeuX) Day Up.
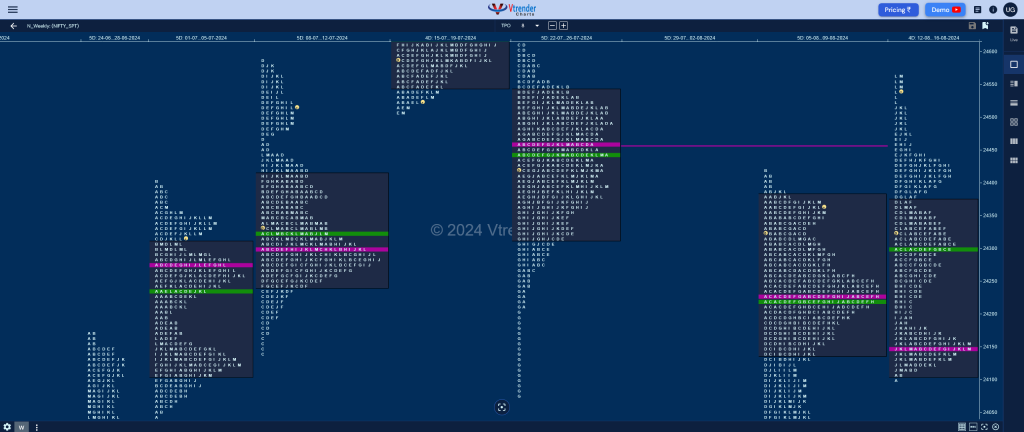
The weekly profile is also a Neutral Extreme one to the upside with almost similar value as previous week at 24111-24149-24371 with the NeuX zone being from 24472 to 24564 which will be the support for the coming week for a test of the gap zone of 24696 and an entry into the well balanced weekly value of 24782-24935-24963 (29Jul-02Aug) whereas on the downside, this week’s HVNs of 24420, 24300 & 24157 will be the levels to watch.

Click here to view this week’s MarketProfile of Nifty on Vtrender Charts
Hypos for 19th Aug – 24541 [ 24564 / 24204 ] – Neutral Extreme (Up)
| Up |
| 24549 – M TPO h/b (16 Aug) 24586 – 1 ATR (SOC 24344) 24641 – 2 ATR (VPOC 24157) 24696 – Weekly Sell Tail (05-09 Aug) 24747 – 1 ATR (yPOC 24505) 24782 – Weekly VAL (29Jul-02Aug) |
| Down |
| 24518 – NeuX low (16 Aug) 24472 – Weekly NeuX low (12-16 Aug) 24420 – Weekly HVN (12-16 Aug) 24384 – 16 Aug Halfback 24344 – SOC (16 Aug) 24275 – SOC (16 Aug) |
Hypos for 20th Aug – 24572 [ 24638 / 24523 ] – Normal Variation (Down)
| Up |
| 24581 – POC (19 Aug) 24638 – WeeklyIBH 24696 – Weekly Sell Tail (05-09 Aug) 24742 – 1 ATR (PDL 24523) 24782 – Weekly VAL (29Jul-02Aug) 24835 – Sell Tail (02 Aug) |
| Down |
| 24558 – VAL (19 Aug) 24518 – NeuX low (16 Aug) 24472 – Weekly NeuX low (12-16 Aug) 24420 – Weekly HVN (12-16 Aug) 24384 – 16 Aug Halfback 24344 – SOC (16 Aug) |
Hypos for 21st Aug – 24698 [ 24734 / 24607 ] – Normal (‘p’ shape)
| Up |
| 24688 – M TPO h/b (20 Aug) 24727 – VAH (20 Aug) 24769 – VPOC (05 Aug) 24835 – Sell Tail (02 Aug) 24862 – 3-day VAL (29-31 Jul) 24935 – Weekly POC |
| Down |
| 24670 – 20 Aug Halfback 24632 – IB Tail mid (20 Aug) 24581 – VPOC (19 Aug) 24541 – Buy tail (19 Aug) 24505 – VPOC (16 Aug) 24469 – Ext Handle (16 Aug) |
Hypos for 22nd Aug – 24770 [ 24788 / 24654 ] – Normal Variation (Up)
| Up |
| 24775 – Sell tail (21 Aug) 24835 – Sell Tail (02 Aug) 24862 – 3-day VAL (29-31 Jul) 24935 – Weekly POC 24987 – VPOC (01 Aug) 25030 – Closing PBH (01 Aug) |
| Down |
| 24763 – M TPO low (21 Aug) 24720 – 21 Aug Halfback 24670 – 20 Aug Halfback 24632 – IB Tail mid (20 Aug) 24581 – VPOC (19 Aug) 24541 – Buy tail (19 Aug) |
Hypos for 23rd Aug – 24811 [ 24867 / 24784 ] Normal (3-1-3)
| Up |
| 24825 – 22 Aug Halfback 24862 – 3-day VAL (29-31 Jul) 24935 – Weekly POC 24987 – VPOC (01 Aug) 25030 – Closing PBH (01 Aug) 25078 – Swing High (01 Aug) |
| Down |
| 24807 – POC (22 Aug) 24763 – M TPO low (21 Aug) 24720 – 21 Aug Halfback 24670 – 20 Aug Halfback 24632 – IB Tail mid (20 Aug) 24581 – VPOC (19 Aug) |
BankNifty Spot: 50516 [ 50830 / 49654 ] Normal Variation (Down) – Outside bar
Previous week’s report ended with this ‘The weekly profile is a Normal One with completely lower Value at 49796-50098-50296 with an initiative selling tail from 50707 to 51189 which will be the supply zone above 50551 for the coming week whereas on the downside, Friday’s singles from 50420 to 50386 will be the immediate demand zone below which BankNifty has a good chance to complete the 80% Rule in the 4-day composite from 50240-50098-49876 and test the swing lows of 49659‘

Monday – 50092 [ 50747 / 49719 ] Trend (Down)
Tuesday – 49748 [ 50688 / 49659 ] – Trend (Down)
Wednesday – 50119 [ 50292 / 49782 ] – Normal (Inside Bar)
Thursday – 50156 [ 50440 / 49829 ] – Normal Variation (Up)
Friday – 50484 [ 50707 / 50386 ] – Normal
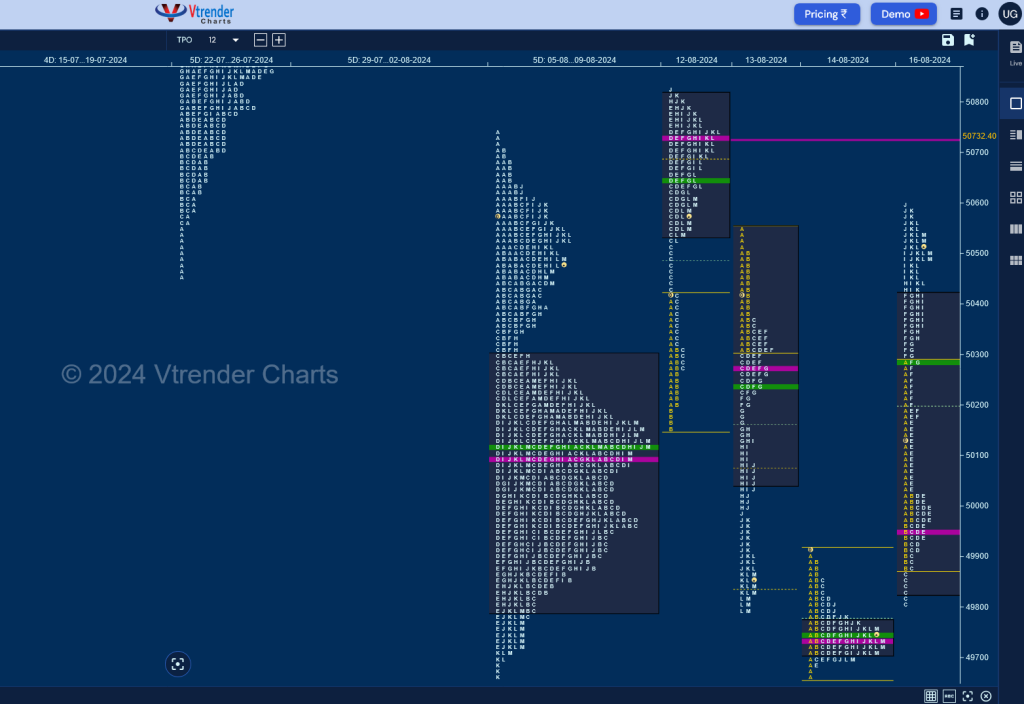
BankNifty opened with a break of the buying tail from 50420 to 50386 triggering the 80% Rule in previous week’s Value and broke below 08th Aug’s VPOC of 50200 but failed to tag the weekly POC of 50098 as it left a buying tail in the IB and went on to make a big C side extension higher completing the 80% Rule in last Friday’s value and continued to make multiple REs till the J TPO where it hit 50830 stalling just below the 2-day VPOC of 50839 (25-26 Jul) marking the end of the upside for the week.
The auction then went on to trend lower on Tuesday completing the expected 80% Rule in previous week’s Value while leaving similar lows of 49794 & 49785 and continued the probe to the downside with a lookdown below previous week’s low of 49659 where it left a small but important initiative buying tail marking the end of the imbalance and formed a narrow range Gaussian Curve with a close around the prominent POC of 49733. Friday then saw confirmation of buyers taking over as the C side extension to 49806 resulted in a Failed Auction (FA) being confirmed and the 1 ATR target of 50459 being achieved while making a high of 50603.
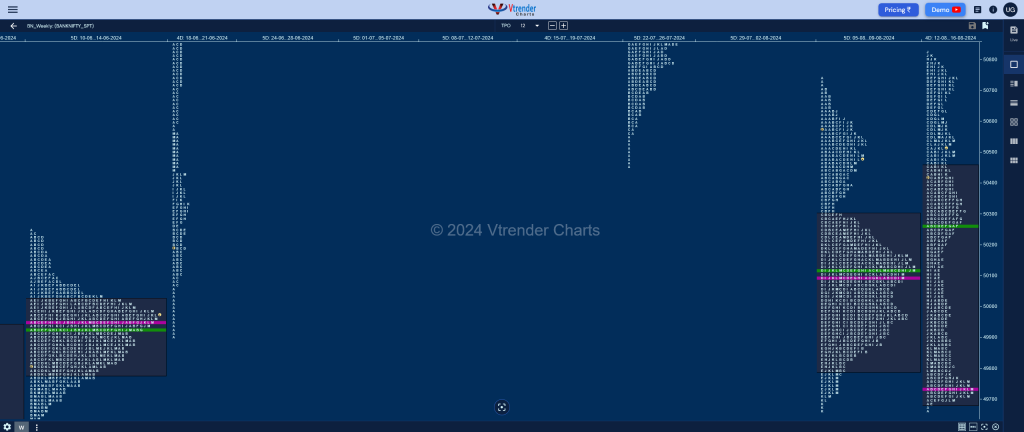
The weekly profile is a Normal Variation one to the downside but has formed an Outside Bar both in terms of range & value thanks to the rejection it saw at the break of previous extremes so can make another attempt to tag that VPOC of 50839 in the coming week as long as it remains above the current Value of 49691-49733-50451.

Click here to view this week’s MarketProfile of BankNifty on Vtrender Charts
Hypos for 20th Aug – 50368 [ 50728 / 50283 ] Normal (‘b’ shape)
| Up |
| 50410 – POC (19 Aug) 50585 – PBH (19 Aug) 50732 – VPOC (12 Aug) 50838 – 2-day VPOC (25-26 Jul) 50968 – Gap mid (05 Aug) 51087 – Monthly Ext Handle |
| Down |
| 50337 – L TPO h/b (19 Aug) 50205 – 16 Aug Halfback 50063 – E TPO h/b (16 Aug) 49950 – VPOC (16 Aug) 49806 – FA (16 Aug) 49654 – Swing Low (14 Aug) |
Hypos for 21st Aug – 50803 [ 51025 / 50398 ] – Normal Variation (Up) – ‘p’ shape
| Up |
| 50857 – L TPO h/b (20 Aug) 50969 – SOC (20 Aug) 51087 – Monthly Ext Handle 51189 – Weekly Tail (05-09 Aug) 51308 – PBL (02 Aug) 51453 – VPOC (02 Aug) |
| Down |
| 50803 – M TPO high 50672 – Ext Handle (20 Aug) 50536 – A TPO h/b (20 Aug) 50410 – VPOC (19 Aug) 50283 – Weekly FA (19 Aug) 50130 – SOC (16 Aug) |
Hypos for 22nd Aug – 50685 [ 50772 / 50333 ] – Neutral
| Up |
| 50716 – M TPO h/b (21 Aug) 50857 – L TPO h/b (20 Aug) 50969 – SOC (20 Aug) 51087 – Monthly Ext Handle 51189 – Weekly Tail (05-09 Aug) 51308 – PBL (02 Aug) |
| Down |
| 50661 – M TPO low (21 Aug) 50553 – 21 Aug Halfback 50411 – VAL (21 Aug) 50283 – Weekly FA (19 Aug) 50130 – SOC (16 Aug) 50020 – SOC (16 Aug) |
Hypos for 23rd Aug – 50985 [ 51080 / 50794 ] – Normal
| Up |
| 50995 – POC (22 Aug) 51087 – Monthly Ext Handle 51189 – Weekly Tail (05-09 Aug) 51308 – PBL (02 Aug) 51453 – VPOC (02 Aug) 51586 – Sell tail (02 Aug) |
| Down |
| 50938 – 22 Aug Halfback 50838 – Buy Tail (22 Aug) 50728 – Weekly IBH 50661 – M TPO low (21 Aug) 50553 – 21 Aug Halfback 50411 – VAL (21 Aug) |
