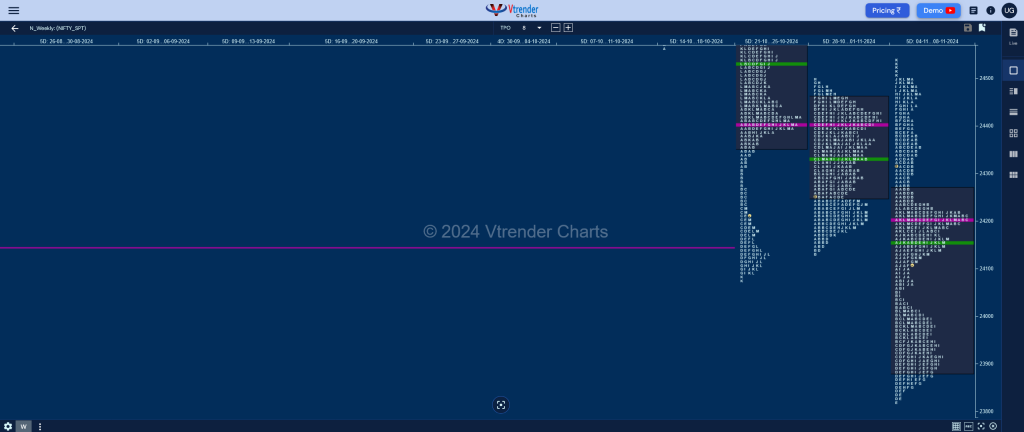
Nifty Spot: 24148 [ 24537 / 23816 ] Outside Bar
Previous week’s report ended with this ‘The weekly profile is a Normal Gaussian Curve of mere 363 points as the auction tested the 24400-24451 zone multiple times on the upside but could not sustain whereas on the downside it confirmed a FA (Failed Auction) at 24140 which will be the immediate support for the coming week below which it could resume the downside towards the Swing Low of 23893 & the weekly extension handle of 23618. This week’s Value was overlapping to lower at 24250-24402-24459 so will need to stay above this balance for any up move towards 24649 & 24750 in the coming sessions‘
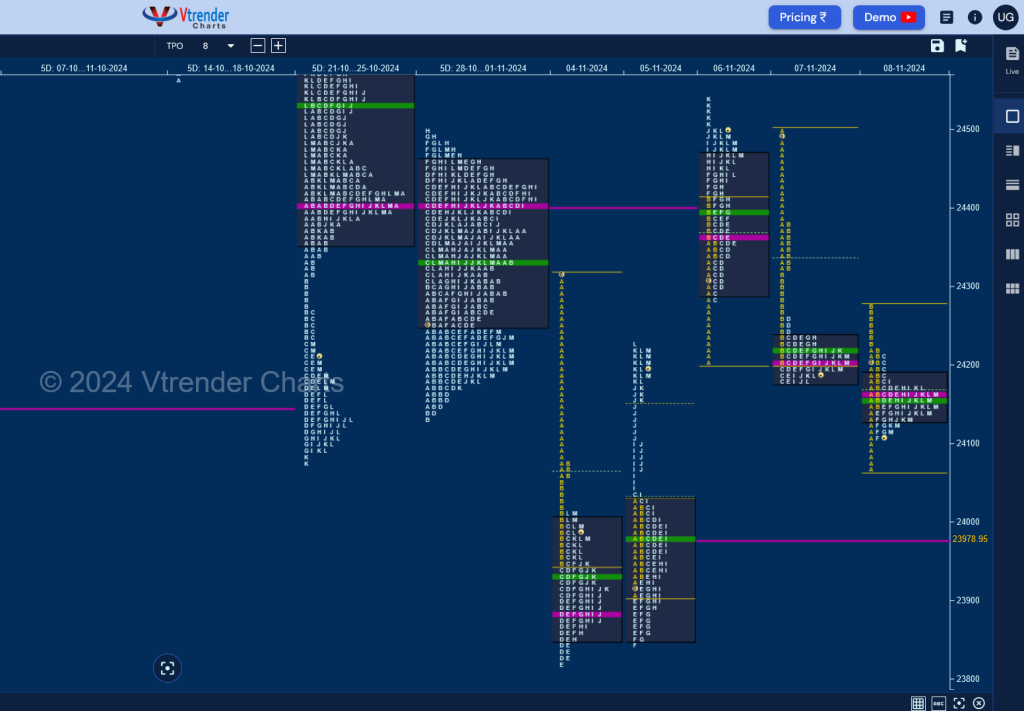
Monday – 23995 [ 24316 / 23816 ] Normal Variation Down (‘b’ shape)
Tuesday – 24213 [ 24229 / 23842 ] Neutral Extreme (Up)
Wednesday – 24484 [ 24537 / 24204 ] – Normal Variation Up (3-1-3)
Thursday – 24199 [ 24503 / 24179 ] Normal (‘b’ shape)
Friday – 24148 [ 24276 / 24066 ] Normal (3-1-3)
Once again we saw balance leading to an imbalance as Nifty started the week with an Open Drive Down moving away from previous value and breaking below the Swing Low of 23893 as it made a low of 23816 but formed a ‘b’ shape profile hinting at exhaustion on the downside which was followed by a probe back into previous week’s profile as it negated a FA at 24036 on Tuesday forming a Neutral Extreme Day Up and gave a rare follow up with a strong open on Wednesday as it completed the 80% Rule in the weekly value and even went on to look up above the highs of 24498 but stalled at the daily VPOC of 24532 while making a high of 24537 and left an important responsive tail in the K TPO marking the return of supply.
The sellers then took complete control with an Open Drive Down on Thursday forcing the buyers to exit forming a ‘b’ shape profile for the day with a prominent POC at 24200 before settling down the action packed dual auction week with a narrow 210 point Normal Day on Friday which is also a 3-1-3 profile forming another prominent POC at 24162. The weekly profile is an Outside Bar with mostly lower Value at 23886-24200-24267 and has left a probable Swing High on the bigger timeframe and will be weak in the coming week if stays below 24200 for a probable test of the important mid-year extension handle of 23754 and Jun’s VPOC of 23535.
Click here to view this week’s MarketProfile of Nifty on Vtrender Charts
Hypos for 11th Nov– 24148 [ 24276 / 24066 ] Normal (3-1-3)
| Up |
| 24162 – POC (08 Nov) 24190 – C TPO h/b (08 Nov) 24250 – IB tail mid (08 Nov) 24292 – B TPO h/b (07 Nov) 24340 – 07 Nov Halfback 24382 – Sell Tail (07 Nov) 24447 – SOC (07 Nov) |
| Down |
| 24144 – TPO HNN (08 Nov) 24104 – Buy Tail (08 Nov) 24065 – I TPO tail (05 Nov) 24000 – I TPO h/b (05 Nov) 23964 – SOC (05 Nov) 23908 – SOC (05 Nov) 23848 – Buy tail (05 Nov) |
Hypos for 12th Nov– 24141 [ 24336 / 24004 ] Normal Variation (Up)
| Up |
| 24162 – M TPO high (11 Nov) 24204 – PBH (11 Nov) 24253 – VAH (11 Nov) 24298 – SOC (11 Nov) 24340 – 07 Nov Halfback 24382 – Sell Tail (07 Nov) 24447 – SOC (07 Nov) |
| Down |
| 24141 – POC (11 Nov) 24080 – Buy Tail (11 Nov) 24042 – IB tail mid (11 Nov) 23980 – VPOC (05 Nov) 23940 – TPO HVN (04-05 Nov) 23908 – SOC (05 Nov) 23848 – Buy tail (05 Nov) |
Hypos for 13th Nov– 23883 [ 24242 / 23839 ] Trend (Down)
| Up |
| 23884 – M TPO high (12 Nov) 23914 – L TPO h/b (12 Nov) 23993 – PBH (12 Nov) 24040 – 12 Nov Halfback 24100 – Ext Handle (12 Nov) 24138 – POC (12 Nov) 24201 – C TPO high (12 Nov) |
| Down |
| 23866 – Buy tail (12 Nov) 23816 – Swing Low (04 Nov) 23754 – Ext Handle (Jun) 23700 – B TPO h/b (26 Jun) 23657 – 25 Jun Halfback 23618 – Ext Handle (25 Jun) 23562 – FA (25 Jun) |
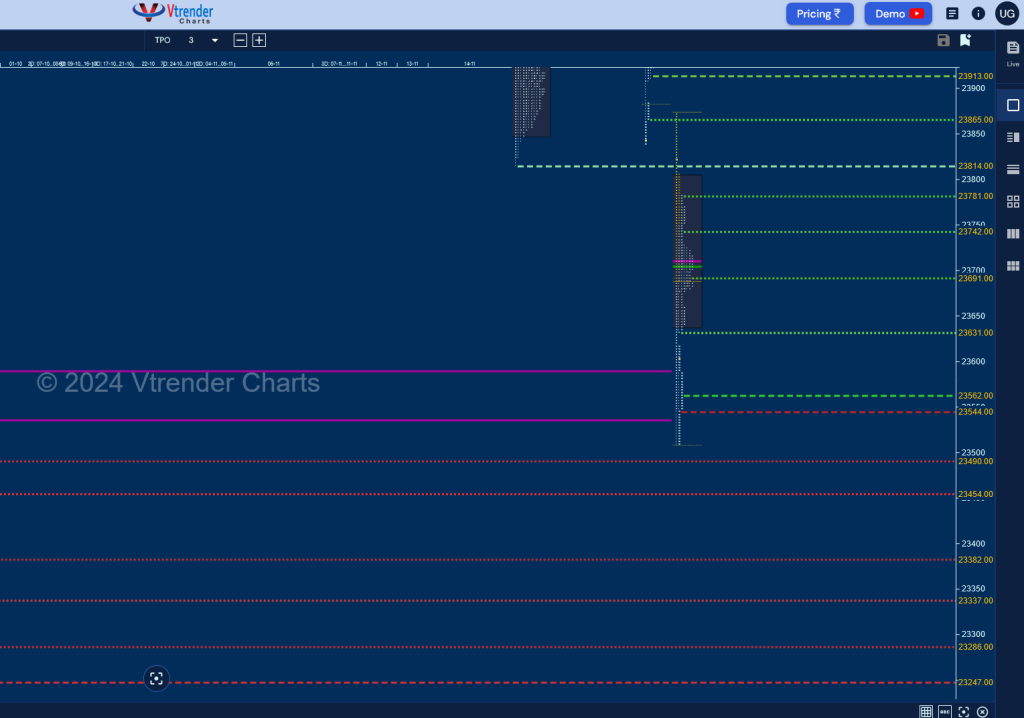
Hypos for 14th Nov– 23559 [ 23873 / 23509 ] – Trend (Down)
| Up |
| 23564 – M TPO h/b (13 Nov) 23632 – Ext Handle (13 Nov) 23691 – 13 Nov Halfback 23742 – D TPO h/b (13 Nov) 23782 – PBH (13 Nov) 23816 – Ext Handle (Nov) 23866 – Buy tail (12 Nov) |
| Down |
| 23544 – Buy tail (13 Nov) 23492 – 5-day VAL (18-24 Jun) 23454 – Ext Handle (24 Jun) 23383 – Buy Tail (24 Jun) 23338 – Buy Tail (14 Jun) 23288 – 2-day VAL (10-11 Jun) 23247 – A TPO h/b (11 Jun) |
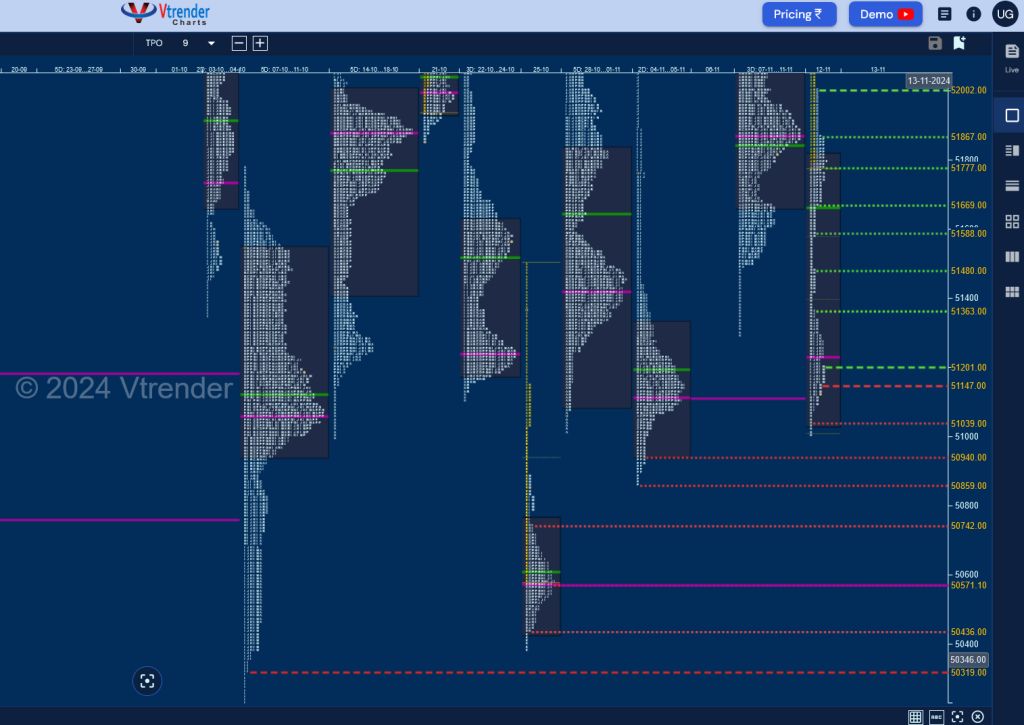
BankNifty Spot: 51561 [ 52494 / 50865 ] Neutral (Outside bar)
Previous week’s report ended with this ‘The weekly profile is a Normal Variation one to the upside but also an Inside bar both in terms of value & range with value at 51075-51421-51845 and the wait for a move away from this overlapping balance of 4 weeks continue into the new week & month for either a test of the weekly VPOC of 53001 on the upside whereas the immediate downside objective would be the daily VPOC of 49950‘
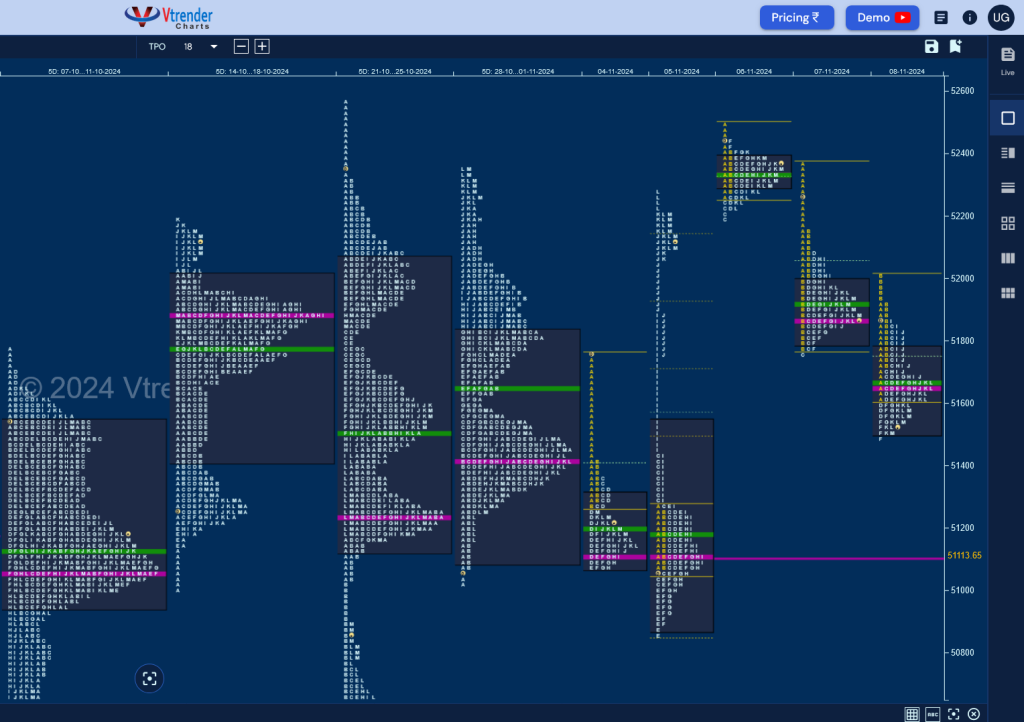
Monday – 51215 [ 51764 / 51066 ] – Normal Variation (Down)
Tuesday – 52207 [ 52289 / 50865 ] – Neutral Extreme (Up)
Wednesday – 52317 [ 52494 / 52185 ] – Normal (3-1-3)
Thursday – 51916 [ 52377 / 51752 ] – Normal (‘b’ shape)
Friday – 51561 [ 52007 / 51494 ] – Normal Variation (Down)
BankNifty opened the week with a Drive Down but could only manage a ‘b’ shape profile with poor lows at 51066 on Monday taking support in previous week’s mini buying tail but the attempt it made to probe higher culminated in a typical C side extension to 51443 on Tuesday which got rejected resulting in a FA getting confirmed even resulting in a look down below previous week’s low as it hit 50865 but this attempt to move away from the higher timeframe 4-week overlapping value did not sustain and could only manage to make a low of 50865 triggering a sharp upmove for the rest of the day which not only negated the FA but went on to confirm a weekly FA at lows and almost tagged the 1 ATR objective of 52298 stalling right at the RO point of 52288 leaving a Neutral Extreme Day Up.
The auction opened higher on Wednesday but could not sustain in the initiative selling tail from 21st Oct as it made a high of 52494 forming a narrow range Gaussian Curve with a prominent POC at 52335 which meant that the upside was getting limited and more confirmation of this came in form of a Drive Down on Thursday which broke the higher extension handle of Wednesday and went on to test the weekly IBH of 51764 where it took a pause but continued the probe lower on Friday where it almost hit the NeuX I TPO halfback of 51493 forming back to back ‘b’ shape profiles on the daily timeframe.
The weekly profile is a Neutral one which has extended previous week on both sides leaving a Swing reference of 50865 but the failure to close above 51764 means that a revisit to that FA could be on in the coming week which if broken and sustained could be the beginning of a fresh leg lower towards 50571 & 50194 whereas on the upside, 51954 & 52192 will be the major supply points above 51764 which if taken out on initiative buying can result in a probe higher towards 52451 & 52977.
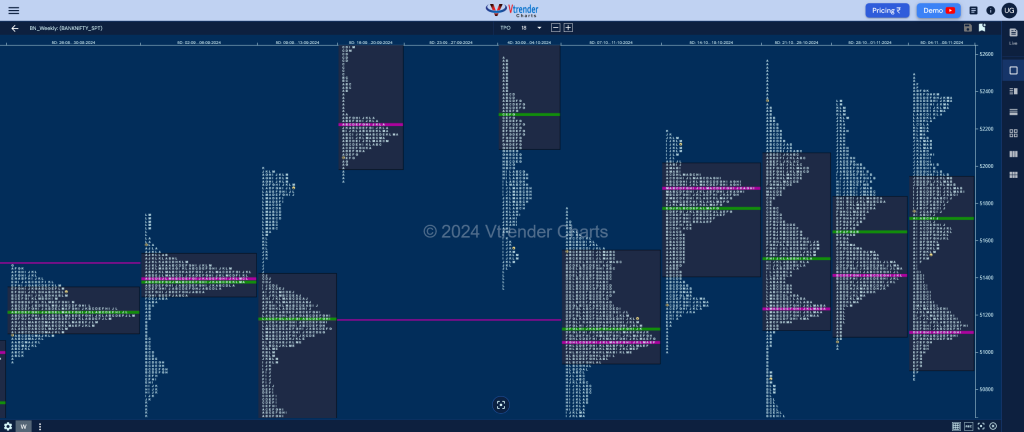
Click here to view this week’s MarketProfile of BankNifty on Vtrender Charts
Hypos for 11 Nov– 51561 [ 52007 / 51494 ] – Normal Variation (Down)
| Up |
| 51594 – L TPO h/b (08 Nov) 51751 – 08 Nov halfback 51923 – Sell Tail (08 Nov) 52064 – 07 Nov Halfback 52192 – A TPO h/b (07 Nov) 52335 – POC (06 Nov) |
| Down |
| 51550 – M TPO h/b (08 Nov) 51415 – Monthly SOC (Nov) 51239 – Oct POC 51113 – VPOC (05 Nov) 50944 – 2-day VAL (04-05 Nov) 50865 – Weekly FA |
Hypos for 12 Nov– 51876 [ 52177 / 51294 ] – Double Distribution (Up)
| Up |
| 51890 – POC (11 Nov) 51965 – PBH (11 Nov) 52078 – PBH (11 Nov) 52192 – A TPO h/b (07 Nov) 52335 – POC (06 Nov) 52451 – Sell Tail (06 Nov) 52577 – Swing High (21 Oct) |
| Down |
| 51869 – Nov POC 51767 – PBL (11 Nov) 51674 – Ext Handle (11 Nov) 51502 – Buy Tail (11 Nov) 51398 – IB Tail mid (11 Nov) 51239 – Oct POC 51113 – VPOC (05 Nov) |
Hypos for 13 Nov– 51157 [ 52169 / 51006 ] – Double Distribution (Down)
| Up |
| 51205 – M TPO high (12 Nov) 51364 – PBH (12 Nov) 51487 – G TPO tail (12 Nov) 51588 – 12 Nov Halfback 51672 – SOC (12 Nov) 51780 – F TPO h/b (12 Nov) 51874 – PBH (12 Nov) 52008 – C TPO high (12 Nov) |
| Down |
| 51152 – M TPO h/b (12 Nov) 51044 – RB tail mid (12 Nov) 50944 – 2-day VAL (04-05 Nov) 50865 – Weekly FA 50749 – SOC (25 Oct) 50570 – VPOC (25 Oct) 50442 – K TPO h/b (25 Oct) 50323 – Buy tail (07 Oct) |
