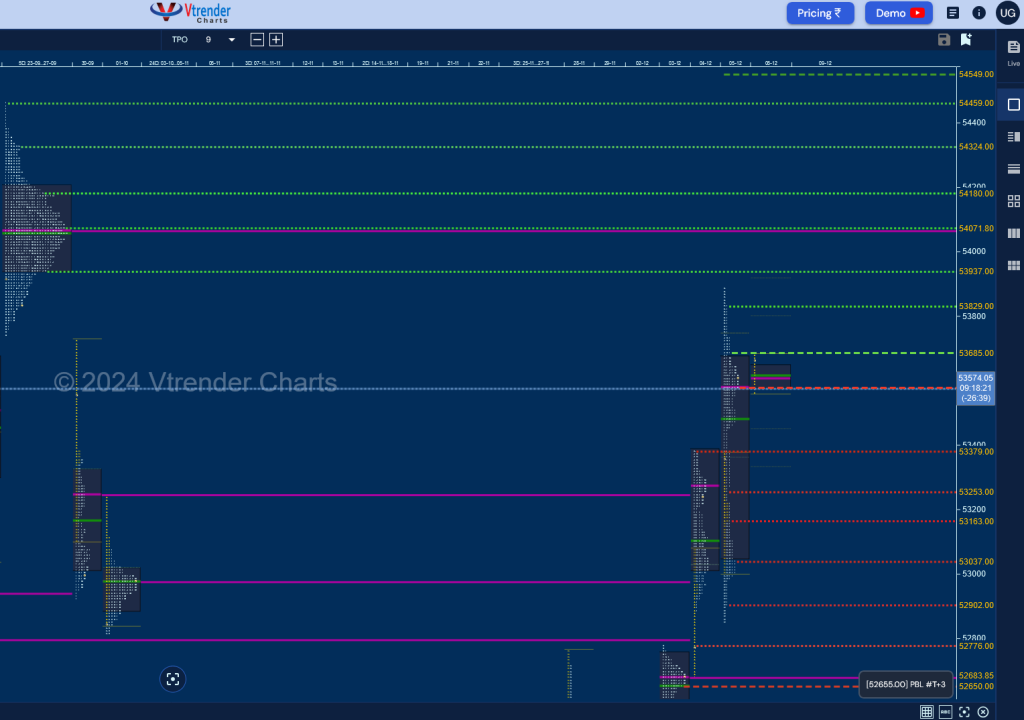
Nifty Spot: 24131 [ 24354 / 23873 ] Neutral
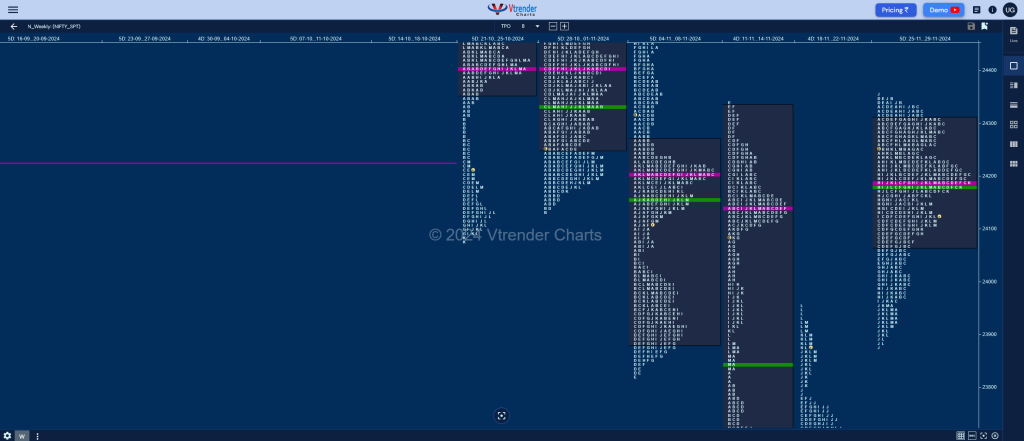
Previous week’s report ended with this ‘The weekly profile is a Neutral Extreme one to the Upside in a range of 693 points with completely lower Value at 23289-23339-23647 not only leaving a weekly FA (Failed Auction) at lows of 23236 but also completing the 1 ATR objective of 23872 with the help of an extension handle at 23780 which will be the support for the coming week and staying above which Nifty could continue to probe higher previous week’s VPOC of 24141 & the 2 ATR target of 24480‘
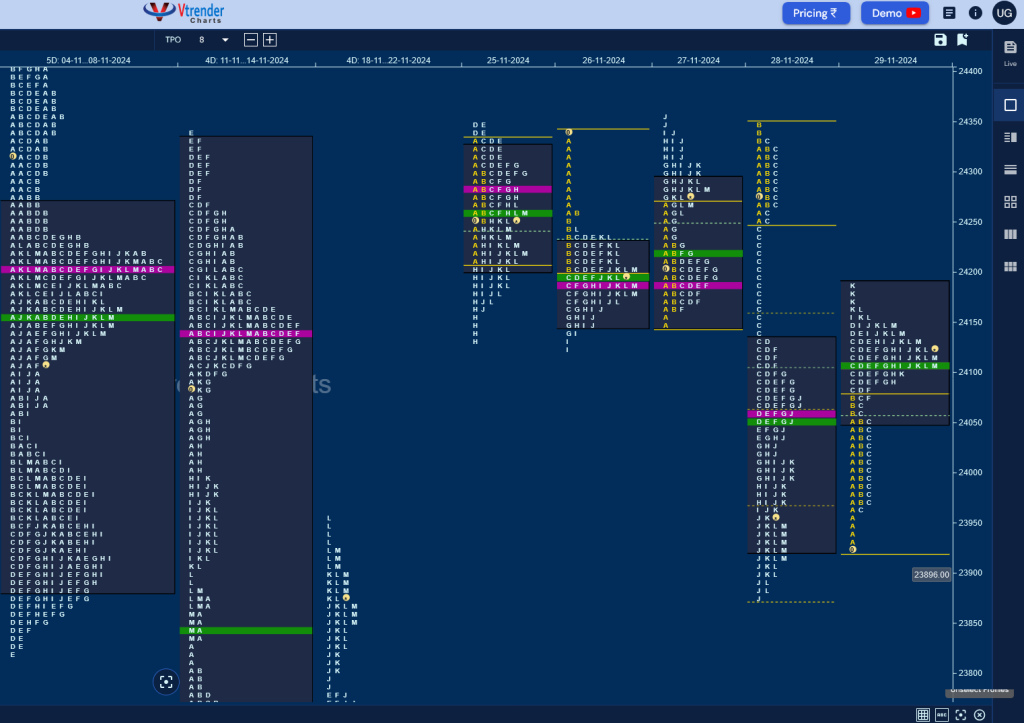
Monday – 24221 [ 24351 / 24135 ] Neutral
Tuesday – 24194 [ 24343 / 24125 ] Normal Variation (Down)
Wednesday – 24274 [ 24354 / 24145 ] Double Distribution (Up)
Thursday – 23914 [ 24345 / 23873 ] Trend (Down)
Friday – 24131 [ 24188 / 23927 ] Normal Variation (Up)
Nifty opened with a big gap up of 346 points on Monday continuing the imbalance close of last Friday and made multiple attempts to sustain above the weekly high of 24336 (11-14 Nov) but could only manage to leave similar highs not just for the day but also over the next 3 sessions and finally gave a move away from this 3.5 day balance on Thursday with an extension handle confirming a weekly FA at 24354 after which it went on to close the gap zone of Monday while making a low of 23873 forming a Trend Day Down.
The auction however did not give any follow up on Friday and in fact left a small initiative buying tail and went on to test the selling zone from 24133 to 24254 forming a ‘p shape kind of a profile as it made a high of 24188 stalling right at November’s POC and has left a well balanced Neutral profile for the week with completely higher Value at 24071-24185-24305 so will need to sustain above 24200 and scale up the zone from 24305 to 24354 for a probe towards the VPOC of 24606 & extension handle of 24750 from 22nd Oct whereas on the downside, 24135 will be the immediate support with the lower one at 24072 and staying below which Nifty could go for a probe towards last week’s extension handle of 23780 along with a test of 22nd Nov’s Halfback of 23657 & SOC of 23508 in the coming week.
Click here to view this week’s MarketProfile of Nifty on Vtrender Charts
Hypos for 02nd Dec – 24131 [ 24188 / 23927 ] Normal Variation (Up)
| Up |
| 24144 – M TPO high (29 Nov) 24200 – C TPO h/b (28 Nov) 24254 – Ext Handle (28 Nov) 24306 – SOC (28 Nov) 24354 – Weekly FA 24401 – November VAH 24447 – SOC (07 Nov) |
| Down |
| 24111 – M TPO low (29 Nov) 24072 – Ext Handle (29 Nov) 24021 – SOC (29 Nov) 23962 – Buy Tail (29 Nov) 23884 – Buy tail (28 Nov) 23834 – L TPO low (22 Nov) 23780 – Weekly Ext Handle |
Hypos for 03rd Dec – 24276 [ 24301 / 24008 ] Double Distribution (Up)
| Up |
| 24306 – SOC (28 Nov) 24354 – Weekly FA 24401 – November VAH 24447 – SOC (07 Nov) 24503 – Sell tail (Nov) 24562 – H TPO h/b (23 Oct) 24606 – VPOC (22 Oct) |
| Down |
| 24262 – Weekly IBH 24216 – J TPO h/b (02 Dec) 24166 – POC (02 Dec) 24122 – PBL (02 Dec) 24079 – Buy Tail (02 Dec) 24021 – SOC (29 Nov) 23962 – Buy Tail (29 Nov) |
Hypos for 04th Dec – 24457 [ 24481 / 24280 ] Double Distribution (Up)
| Up |
| 24466 – M TPO high (03 Dec) 24503 – Sell tail (Nov) 24562 – H TPO h/b (23 Oct) 24606 – VPOC (22 Oct) 24658 – Ext Handle (22 Oct) 24702 – PBH (22 Oct) 24750 – Ext Handle (22 Oct) |
| Down |
| 24449 – M TPo h/b (03 Dec) 24401 – PBL (03 Dec) 24348 – SOC (03 Dec) 24300 – Buy Tail (03 Dec) 24262 – Weekly IBH 24216 – J TPO h/b (02 Dec) 24166 – POC (02 Dec) |
Hypos for 05th Dec – 24467 [ 24573 / 24366 ] Normal Variation (Down)
| Up |
| 24469 – M TPO h/b (04 Dec) 24504 – SOC (04 Dec) 24561 – Sell Tail (04 Dec) 24606 – VPOC (22 Oct) 24658 – Ext Handle (22 Oct) 24702 – PBH (22 Oct) 24750 – Ext Handle (22 Oct) |
| Down |
| 24456 – M TPO low (04 Dec) 24401 – PBL (03 Dec) 24348 – SOC (03 Dec) 24300 – Buy Tail (03 Dec) 24262 – Weekly IBH 24216 – J TPO h/b (02 Dec) 24166 – VPOC (02 Dec) |
Hypos for 06th Dec – 24708 [ 24857 / 24295 ] Neutral Extreme (Up)
| Up |
| 24727 – M TPO h/b (05 Dec) 24795 – SOC (05 Dec) 24864 – 3-day VAH (17-21 Oct) 24928 – IS tail mid (21 Oct) 24978 – Weekly IBH 25013 – POC (16 Oct) 25060 – Sell Tail (16 Oct) 25110 – 15 Oct Halfback |
| Down |
| 24694 – M TPO low (05 Dec) 24619 – I TPO h/b (05 Dec) 24573 – Monthly IBH 24539 – NeuX Handle 24473 – F TPO h/b (05 Dec) 24406 – POC (05 Dec) 24368 – SOC (05 Dec) 24306 – Buy tail mid (05 Dec) |
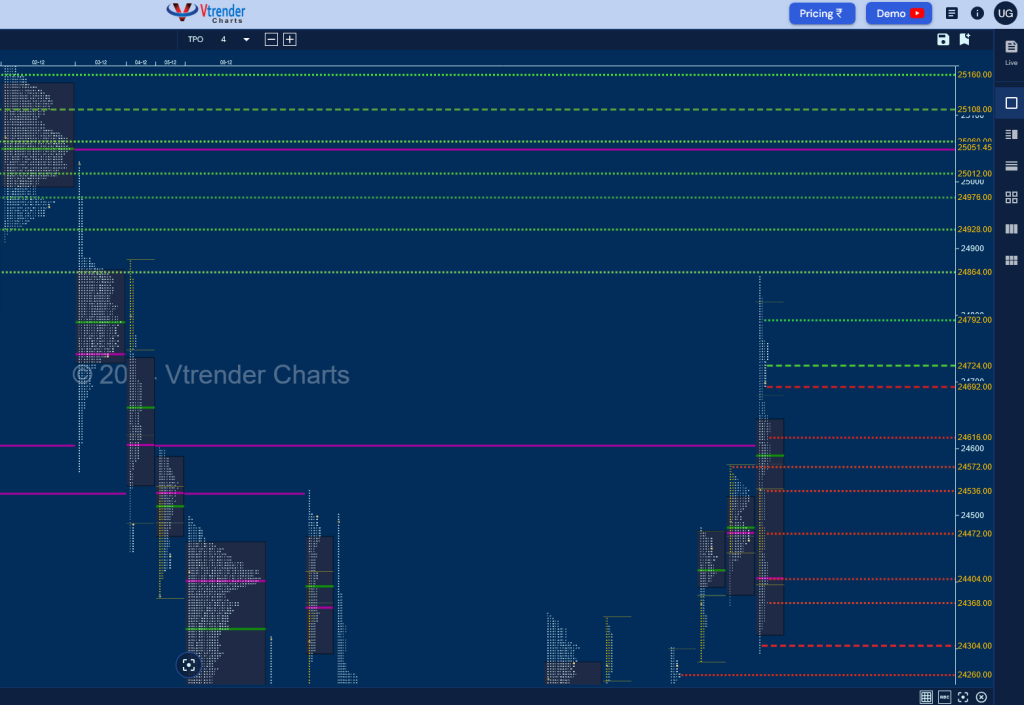
BankNifty Spot: 52055 [ 52760 / 51759 ] Neutral Centre
Previous week’s report ended with this ‘The weekly profile is a Neutral Extreme one to the Upside after BankNifty took support above the weekly VPOC of 49732 while making a low of 49787 & leaving an A period buying tail on the daily timeframe with later on also confirming a weekly FA promptly completing the 1 ATR goal of 51256 while making new highs for the week at 51271 and has an immediate supply point at 51294 which if taken out & sustained could continue the probe higher towards the Swing High of 52177 & the weekly DD zone from 52566 to 52816 along with the weekly VPOC of 53001 in the coming week‘

Monday – 52207 [ 52331 / 51774 ] Normal (‘p’ shape)
Tuesday – 52191 [ 52555 / 51999 ] – Normal (‘b’ shape)
Wednesday – 52301 [ 52444 / 52019 ] – Normal Variation (Up)
Thursday – 51906 [ 52760 / 51783 ] – Trend (Down)
Friday – 52055 [ 52170 / 51759 ] – Normal
BankNifty opened the week with a huge gap up of 910 points taking out the supply point of 52177 on Monday and followed it up with new highs of 52555 on Tuesday stalling right below the weekly DD zone from 52566 and left an initiative selling tail after which it formed an inside day forming a nice 3-day balance and a 3-1-3 composite and made an attempt to move away from there with an Open Drive Up on Thursday as it ventured deep into the DD zone forging new highs of 52760 in the Initial Balance but could not extend any further triggering a long liquidation break lower as it went on to almost tag lows of Monday forming a Trend Day Down.
The auction then turned back to balance mode on Friday forming a narrow range Normal day with completely inside value completing an ideal Gaussian Curve on the weekly timeframe with a close in the middle building a Neutral Centre one with completely higher value at 51921-52096-52250 so will need to see if the balance continues in the coming week which has the important RBI event on Friday or it gives a fresh impulse with the upside objective being the 30th Sep VPOC of 53248 in case buyers are more aggressive whereas on the downside, sellers will aim at the important monthly reference of 50865 in case they take over the control.
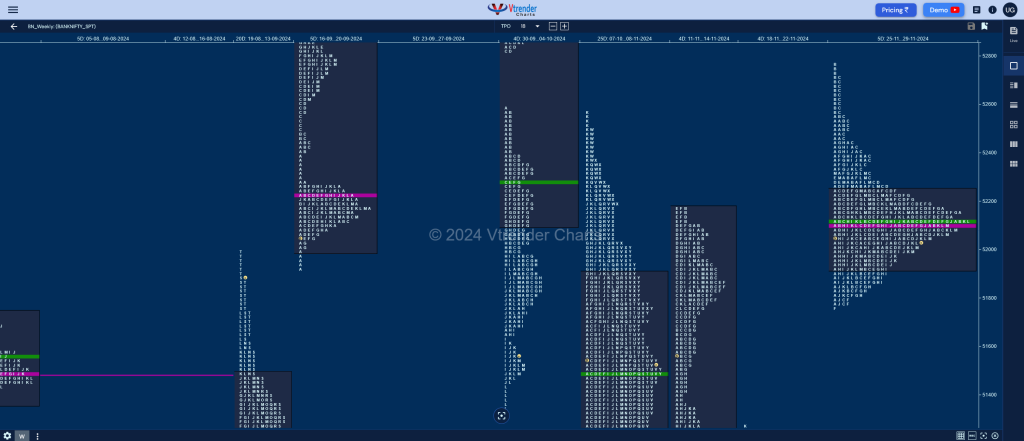
Click here to view this week’s MarketProfile of BankNifty on Vtrender Charts
Hypos for 02nd Dec – 52055 [ 52170 / 51759 ] – Normal
| Up |
| 52096 – Weekly POC 52250 – Weekly VAH 52364 – Ext Handle (28 Nov) 52488 – SOC (28 Nov) 52624 – B TPO h/b (28 Nov) 52718 – Sell Tail (28 Nov) 52817 – Daily Ext Handle |
| Down |
| 52041 – POC (29 Nov) 51921 – Weekly VAL 51778 – Buy tail (29 Nov) 51648 – 1 ATR (POC 52386) 51515 – Weekly tail mid 51421 – Ext Handle (12 Nov) 51294 – SOC |
Hypos for 03rd Dec – 52109 [ 52197 / 51693 ] Normal (Outside Day)
| Up |
| 52119 – Weekly IBH 52250 – Weekly VAH 52364 – Ext Handle (28 Nov) 52488 – SOC (28 Nov) 52624 – B TPO h/b (28 Nov) 52718 – Sell Tail (28 Nov) 52817 – Daily Ext Handle |
| Down |
| 52084 – M TPO h/b (02 Dec) 51945 – 02 Dec Halfback 51840 – POC (02 Dec) 51736 – Buy tail (02 Dec) 51591 – Gap mid (25 Nov) 51482 – Weekly 1.5 IB 51400 – 1 ATR (Prev close) |
Hypos for 04th Dec – 52695 [ 52780 / 52116 ] – Normal Variation (Up)
| Up |
| 52720 – M TPO high (03 Dec) 52817 – Daily Ext Handle (03 oct) 52977 – VPOC (01 Oct) 53114 – Sell Tail (01 Oct) 53248 – VPOC (30 Sep) 53381 – Sell Tail (30 Sep) 53537 – A TPO h/b (30 Sep) |
| Down |
| 52655 – PBL (03 Dec) 52498 – 03 Dec Halfback 52352 – A TPO h/b (03 Dec) 52216 – Monthly Tail (Dec) 52084 – M TPO h/b (02 Dec) 51945 – 02 Dec Halfback 51839 – VPOC (02 Dec) |
Hypos for 05th Dec – 53267 [ 53387 / 52685 ] – Normal Variation (Up)
| Up |
| 53274 – POC (04 Dec) 53386 – VAH (04 Dec) 53537 – A TPO h/b (30 Sep) 53696 – Gap mid (30 Sep) 53832 – M TPO h/b (27 Sep) 53941 – Weekly VAL (23-27 Sep) 54072 – Weekly VPOC (23-27 Sep) 54183 – VPOC (27 Sep) |
| Down |
| 53259 – M TPO h/b (04 Dec) 53195 – Ext Handle (04 Dec) 53039 – 04-Dec Halfback 52884 – Buy Tail (04 Dec) 52780 – Ext Handle 52655 – PBL (03 Dec) 52498 – 03 Dec Halfback 52352 – A TPO h/b (03 Dec) |
Hypos for 06th Dec – 53603 [ 53888 / 52850 ] – Neutral Extreme (Up)
| Up |
| 53691 – SOC (05 Dec) 53835 – Sell tail (05 Dec) 53941 – Weekly VAL (23-27 Sep) 54072 – Weekly VPOC (23-27 Sep) 54183 – VPOC (27 Sep) 54327 – FA (27 Sep) 54467 – ATH 54555 – 2 ATR (SOC 53168) |
| Down |
| 53583 – POC (05 Dec) 53387 – Monthly IBH 53253 – F TPO h/b (05 Dec) 53168 – SOC (05 Dec) 53039 – SOC (05 Dec) 52909 – Buy tail (05 Dec) 52780 – Ext Handle 52655 – PBL (03 Dec) |
