Nifty Spot: 24677 [ 24857 / 24008 ] Trend (Up)
Previous week’s report ended with this ‘Nifty has formed a well balanced Neutral profile for the week with completely higher Value at 24071-24185-24305 so will need to sustain above 24200 and scale up the zone from 24305 to 24354 for a probe towards the VPOC of 24606 & extension handle of 24750 from 22nd Oct whereas on the downside, 24135 will be the immediate support with the lower one at 24072 and staying below which Nifty could go for a probe towards last week’s extension handle of 23780 along with a test of 22nd Nov’s Halfback of 23657 & SOC of 23508 in the coming week‘
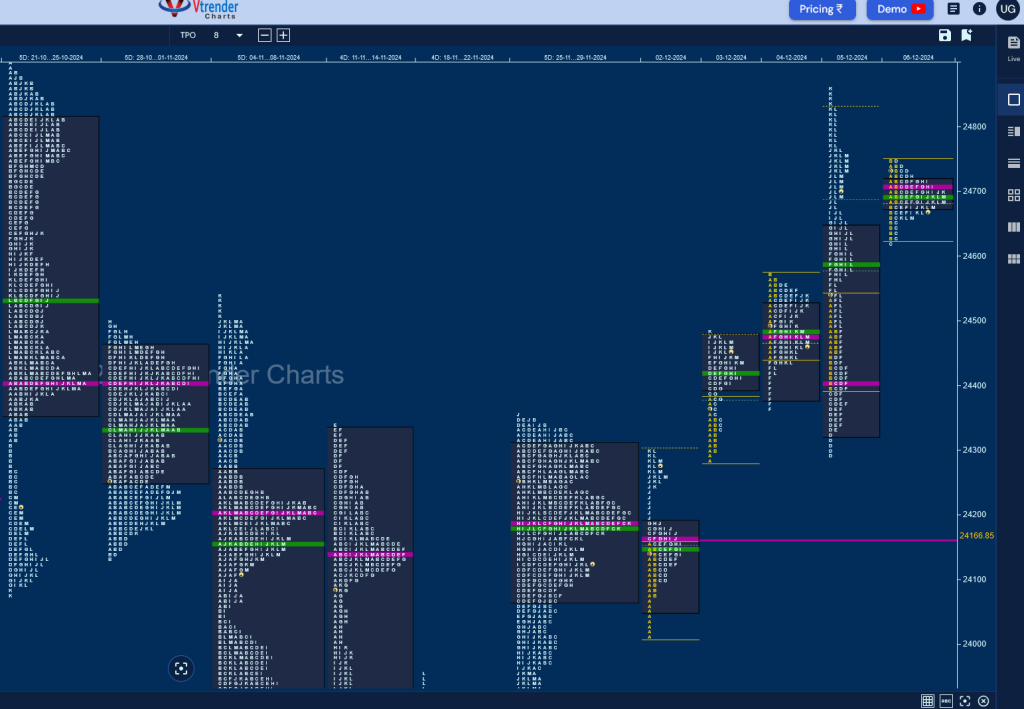
Monday – 24276 [ 24301 / 24008 ] Double Distribution (Up)
Tuesday – 24457 [ 24481 / 24280 ] Double Distribution (Up)
Wednesday – 24467 [ 24573 / 24366 ] Normal Variation (Down)
Thursday – 24708 [ 24857 / 24295 ] Neutral Extreme (Up)
Friday – 24677 [ 24751 / 24620 ] Normal (Inside Day)
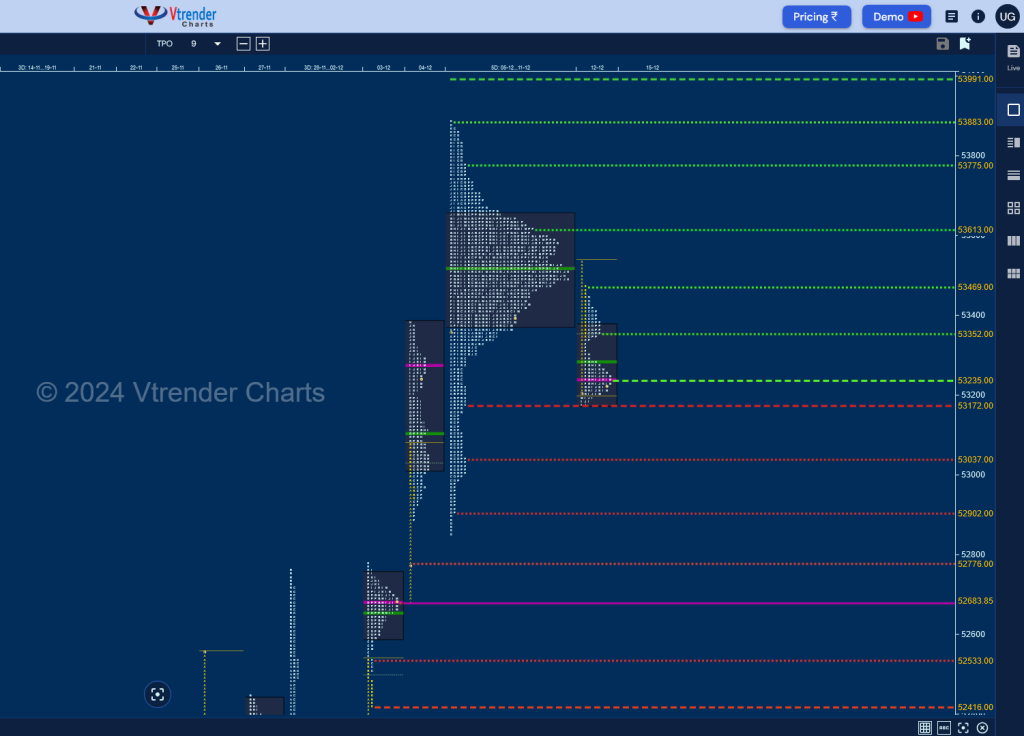
Nifty has formed a Trend Up profile on the weekly timeframe with completely higher Value at 24320-24463-24716 and is likely to return back to balance mode which was visible on the last day as it formed a narrow 131 point range Inside Day to close the week around the upper HVN of 24700 which will be the level to sustain for more upside in the coming week. On the downside, we have a zone of singles from 24246 to 24190 which will be an important support zone below which we have the initiative buying tail from 24079 which will be the swing reference.

Click here to view this week’s MarketProfile of Nifty on Vtrender Charts
Hypos for 09th Dec – 24677 [ 24751 / 24620 ] Normal (Inside Day)
| Up |
| 24705 – POC (06 Dec) 24751 – PDH 24795 – SOC (05 Dec) 24864 – 3-day VAH (17-21 Oct) 24928 – IS tail mid (21 Oct) 24978 – Weekly IBH 25013 – POC (16 Oct) |
| Down |
| 24658 – PBL (06 Dec) 24619 – I TPO h/b (05 Dec) 24573 – Monthly IBH 24539 – NeuX Handle 24473 – F TPO h/b (05 Dec) 24406 – POC (05 Dec) 24368 – SOC (05 Dec) |
Hypos for 10th Dec – 24619 [ 24705 / 24580 ] Normal
| Up |
| 24627 – POC (09 Dec) 24663 – PBH (09 Dec) 24705 – VPOC (06 Dec) 24751 – Monthly tail 24795 – SOC (05 Dec) 24864 – 3-day VAH (17-21 Oct) 24928 – IS tail mid (21 Oct) |
| Down |
| 24618 – M TPO h/b (09 Dec) 24573 – Monthly IBH 24539 – NeuX Handle 24473 – F TPO h/b (05 Dec) 24406 – POC (05 Dec) 24368 – SOC (05 Dec) 24306 – Buy tail mid (05 Dec) |
Hypos for 11th Dec – 24610 [ 24677 / 24510 ] Double Distribution (Down)
| Up |
| 24628 – Closing PBH (10 Dec) 24665 – Sell Tail (10 Dec) 24705 – VPOC (06 Dec) 24751 – Monthly tail 24795 – SOC (05 Dec) 24864 – 3-day VAH (17-21 Oct) 24928 – IS tail mid (21 Oct) |
| Down |
| 24606 – M TPO low (10 Dec) 24555 – POC (10 Dec) 24510 – PDL 24463 – Weekly POC 24406 – VPOC (05 Dec) 24368 – SOC (05 Dec) 24306 – Buy tail mid (05 Dec) |
Hypos for 12th Dec – 24641 [ 24691 / 24583 ] Normal Variation (Up)
| Up |
| 24653 – POC (11 Dec) 24705 – VPOC (06 Dec) 24751 – Monthly tail 24795 – SOC (05 Dec) 24830 – Weekly 2 IB 24864 – 3-day VAH (17-21 Oct) 24920 – 1 ATR (yPOC 24653) |
| Down |
| 24637 – M TPO h/b (11 Dec) 24597 – Buy Tail (11 Dec) 24555 – VPOC (10 Dec) 24510 – Swing Low (10 Dec) 24463 – Weekly POC 24406 – VPOC (05 Dec) 24368 – SOC (05 Dec) |
Hypos for 13th Dec – 24548 [ 24675 / 24528 ] Double Distribution (Down)
| Up |
| 24555 – POC (12 Dec) 24601 – 12-Dec Halfback 24655 – Sell Tail (12 Dec) 24705 – VPOC (06 Dec) 24751 – Monthly tail 24795 – SOC (05 Dec) 24830 – Weekly 2 IB |
| Down |
| 24547 – M TPO h/b (12 Dec) 24510 – Swing Low (10 Dec) 24463 – Weekly POC 24406 – VPOC (05 Dec) 24368 – SOC (05 Dec) 24306 – Buy tail mid (05 Dec) 24269 – M TPO h/b (02 Dec) |
BankNifty Spot: 53509 [ 53387 / 51694 ] Triple Distribution (Up)
Previous week’s report ended with this ‘BankNifty completed an ideal Gaussian Curve on the weekly timeframe with a close in the middle building a Neutral Centre one with completely higher value at 51921-52096-52250 so will need to see if the balance continues in the coming week which has the important RBI event on Friday or it gives a fresh impulse with the upside objective being the 30th Sep VPOC of 53248 in case buyers are more aggressive whereas on the downside, sellers will aim at the important monthly reference of 50865 in case they take over the control‘
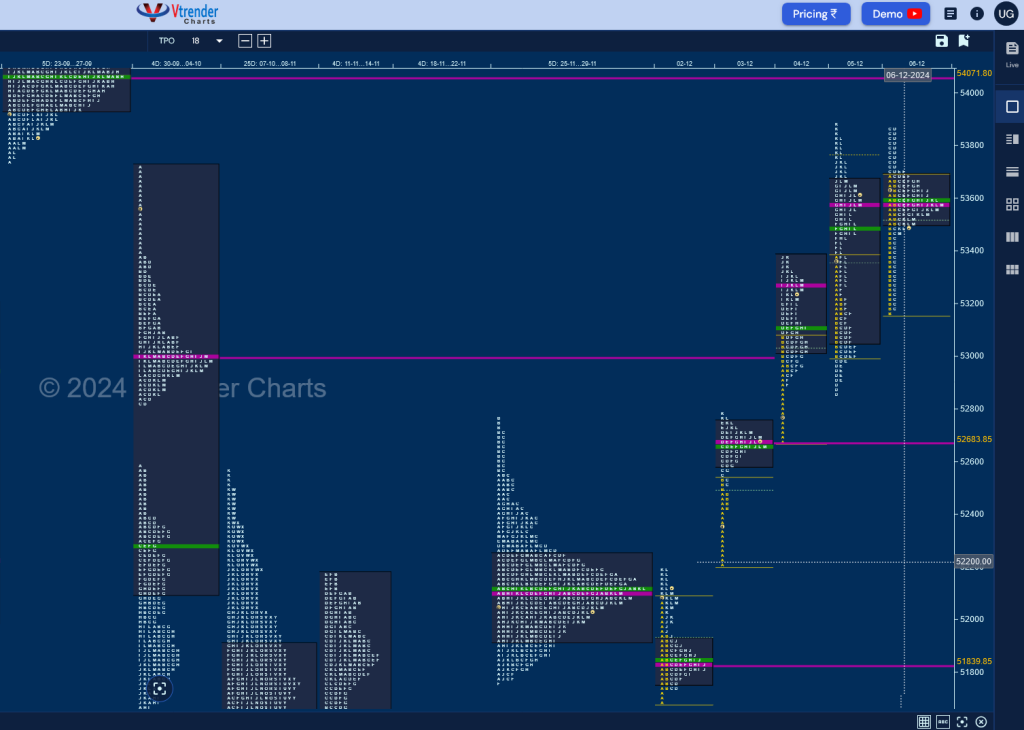
Monday – 52109 [ 52197 / 51693 ] Normal (Outside Day)
Tuesday – 52695 [ 52780 / 52116 ] – Normal Variation (Up)
Wednesday – 53267 [ 53387 / 52685 ] – Normal Variation (Up)
Thursday – 53603 [ 53888 / 52850 ] – Neutral Extreme (Up)
Friday – 53509 [ 53868 / 53160 ] – Normal (Inside Day)
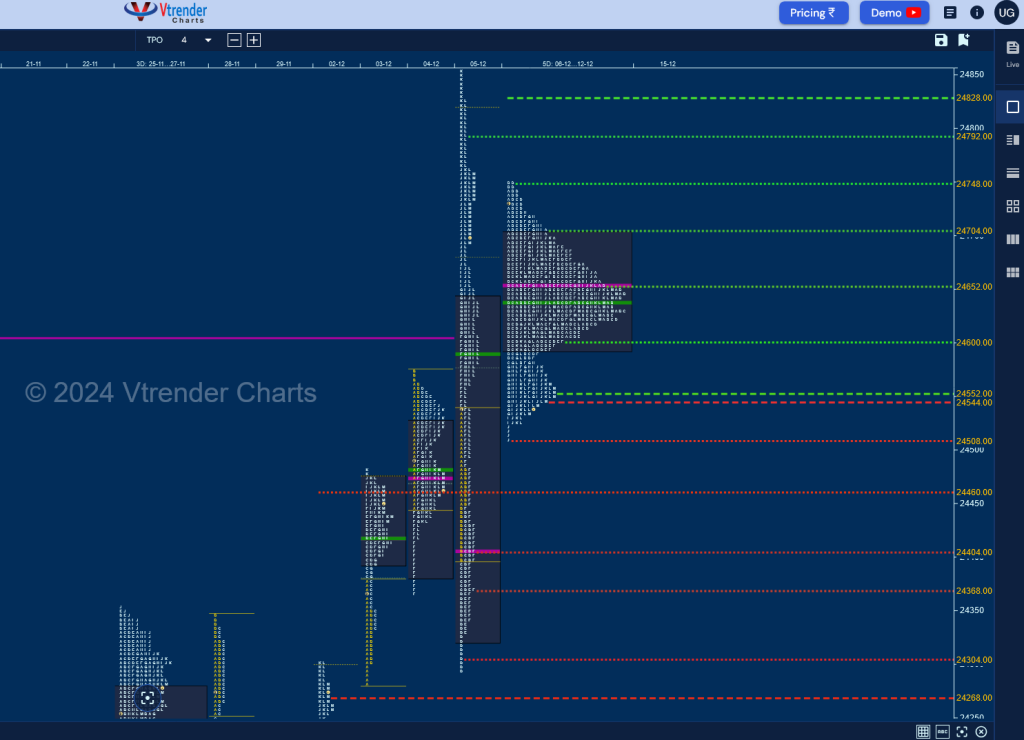
BNF made an attempt to probe below previous week’s Gaussian Curve but got rejected triggering an elongated 2194 points range Triple Distribution Trend Up profile on the weekly which not only tagged the higher weekly VPOC of 53001 but went on to almost test the older Gaussian Curve from 23rd to 27th Sep while making a high of 53888 but has seen the POC shift higher to 53581 which will be the reference for the coming week as it may consolidate before resuming the upside. Value was completely higher at 52709-53581-53883 and we have couple of buy side extension handles at 52780 & 52190 which will be the important demand levels for the rest of the month.
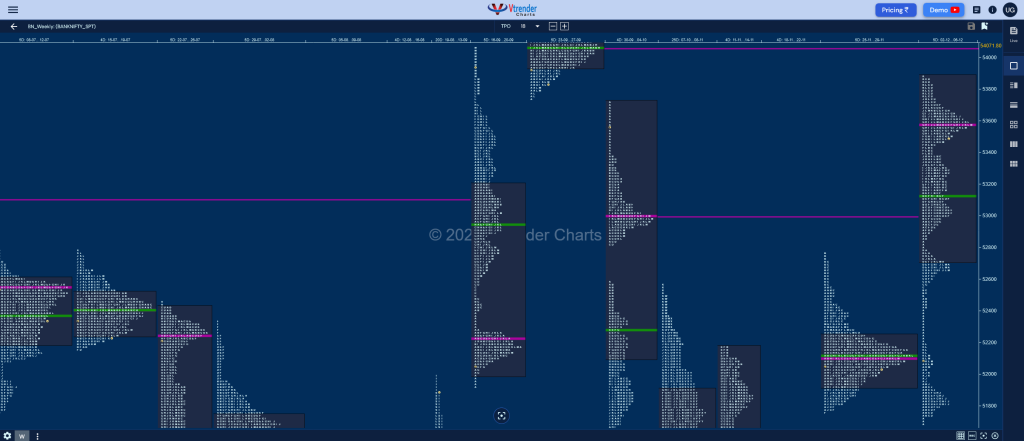
Click here to view this week’s MarketProfile of BankNifty on Vtrender Charts
Hypos for 09th Dec – 53509 [ 53868 / 53160 ] – Normal (Inside Day)
| Up |
| 53581 – POC (06 Dec) 53693 – VAH (06 Dec) 53857 – Sell tail (06 Dec) 53941 – Weekly VAL (23-27 Sep) 54072 – Weekly VPOC (23-27 Sep) 54183 – VPOC (27 Sep) 54327 – FA (27 Sep) |
| Down |
| 53503 – VAL (06 Dec) 53387 – Monthly IBH 53178 – Buy Tail (06 Dec) 53039 – SOC (05 Dec) 52909 – Buy tail (05 Dec) 52780 – Ext Handle 52655 – PBL (03 Dec) |
Hypos for 10th Dec – 53407 [ 53775 / 53326 ] Normal (Double Inside Bar)
| Up |
| 53429 – 3-day VAL (05-09 Dec) 53580 – POC (06 Dec) 53677 – F TPO h/b (09 Dec) 53775 – Weekly IBH 53888 – Swing High (05 Dec) 53999 – Weekly 1.5 IB 54148 – Ext Handle (27 Sep) |
| Down |
| 53408 – M TPO h/b (09 Dec) 53326 – Weekly IBL 53178 – Buy Tail (06 Dec) 53039 – SOC (05 Dec) 52909 – Buy tail (05 Dec) 52780 – Ext Handle 52655 – PBL (03 Dec) |
Hypos for 11th Dec – 53577 [ 53624 / 53302 ] – Normal
| Up |
| 53580 – 4-day POC (05-10 Dec) 53662 – 4-day VAH (05-10 Dec) 53775 – Weekly IBH 53888 – Swing High (05 Dec) 53999 – Weekly 1.5 IB 54148 – Ext Handle (27 Sep) 54327 – FA (27 Sep) |
| Down |
| 53550 – M TPO low (10 Dec) 53463 – 10 Dec Halfback 53302 – PDL 53178 – Buy Tail (06 Dec) 53039 – SOC (05 Dec) 52909 – Buy tail (05 Dec) 52780 – Ext Handle |
Hypos for 12th Dec – 53391 [ 53648 / 53302 ] – Neutral
| Up |
| 53399 – VAL (11 Dec) 53485 – POC (11 Dec) 53619 – Sell tail (11 Dec) 53775 – Weekly IBH 53888 – Swing High (05 Dec) 53999 – Weekly 1.5 IB 54148 – Ext Handle (27 Sep) |
| Down |
| 53379 – 5-day VAL (05-11 Dec) 53302 – FA (11 Dec) 53178 – Buy Tail (06 Dec) 53039 – SOC (05 Dec) 52909 – Buy tail (05 Dec) 52780 – Ext Handle 52655 – PBL (03 Dec) |
Hypos for 13th Dec – 53216 [ 53537 / 53174 ] – Double Distribution (Down)
| Up |
| 53235 – POC (12 Dec) 53355 – 12 Dec Halfback 53470 – Sell Tail (12 Dec) 53619 – Sell tail (11 Dec) 53775 – Weekly IBH 53888 – Swing High (05 Dec) 53999 – Weekly 1.5 IB |
| Down |
| 53178 – Buy Tail (06 Dec) 53039 – SOC (05 Dec) 52909 – Buy tail (05 Dec) 52780 – Ext Handle 52683 – VPOC (03 Dec) 52538 – Ext Handle (03 Dec) 52424 – Buy Tail (03 Dec) |
