Nifty Spot Weekly Profile (19th to 23rd August)
10829 [ 11147 / 10637 ]
Last week’s report ended with this line ‘Nifty has made an inside bar on the weekly though the Value was higher at 10979-11042-11079 and the auction looks set to give a move away from this balance in the coming week‘ and the auction obliged by making a huge move leaving a range of 510 points which was the biggest weekly range in the last 9 months.
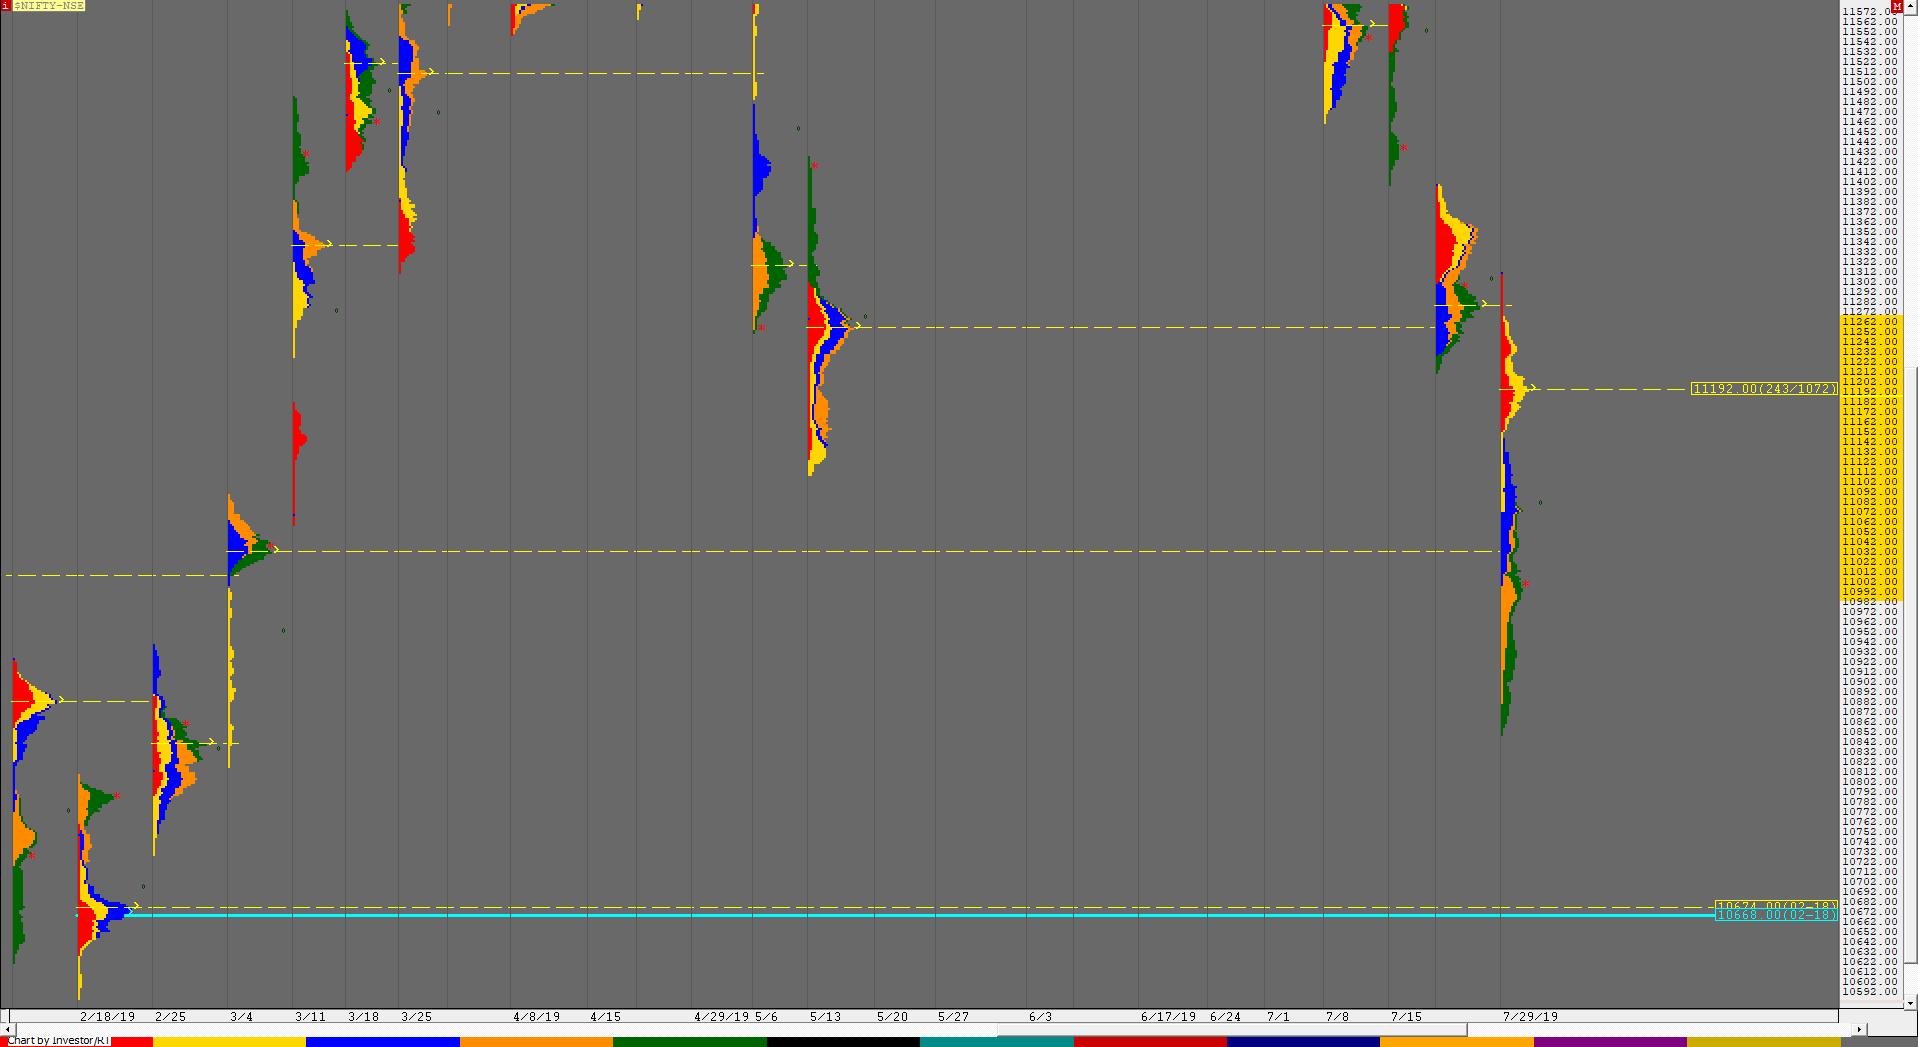
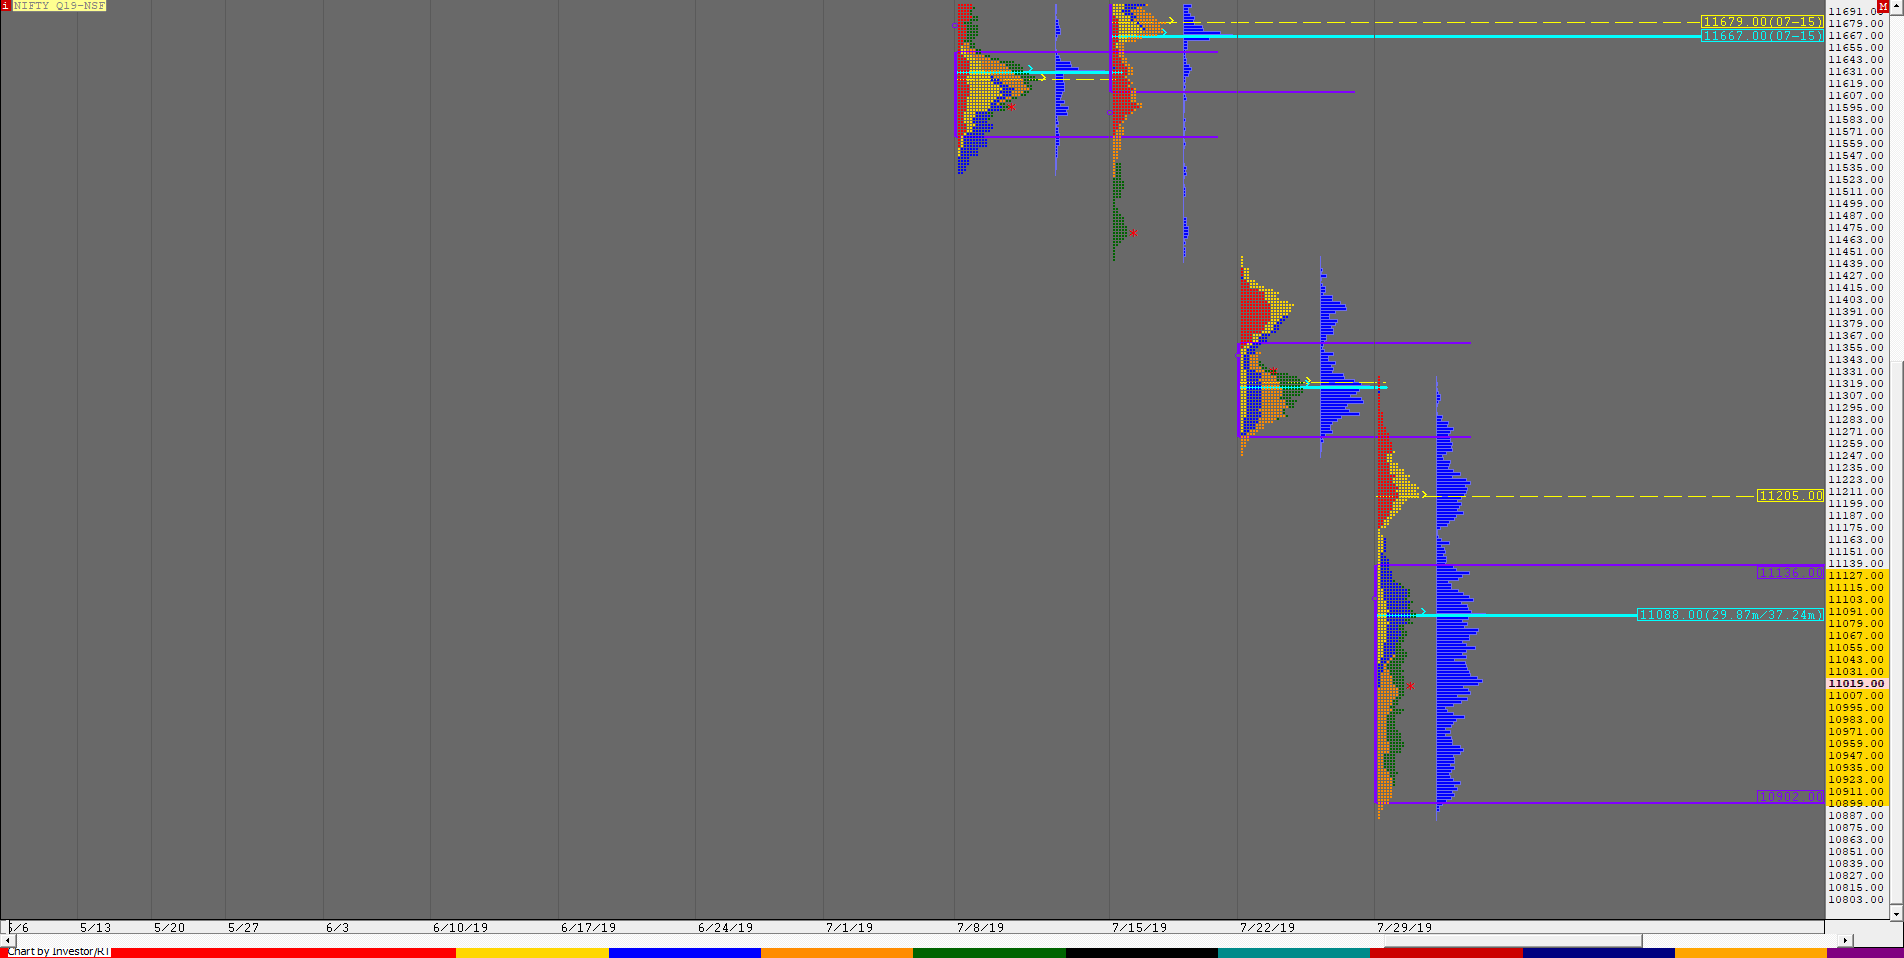
Nifty started the week with a gap up as it stayed above the weekly Value and probed higher tagging the previous week’s high of 11146 but could not sustain above it and this rejection led to a reversal as it not only retraced the entire up move of the day but went on to close the gap to get back into the weekly Value leaving a Neutral Extreme Down Day on the first day of the week which suggested that an initiative player has entered the auction changing the PLR (Path of Least Resistance) to the downside. This was further confirmed on Tuesday when the auction got rejected at open from just below the weekly VAH of 11079 and then went on to complete the 80% Rule in the weekly Value as it made a low of 10985 making a balanced profile for the day. Nifty made a lower low of 10982 at open on Wednesday but still held above that weekly VAL of 10979 which triggered a probe higher in the IB (Initial Balance) as it tagged 11034 stalling just below the weekly POC of 11042 and for the third time in 3 days the auction got rejected at a key reference making lower highs on the daily which meant that the probe lower is still not completed. In fact this rejection from 11034 only added to the downside momentum as Nifty broke below the weekly Value and made a trending move lower till Friday morning breaking not just the previous week lows but also making new lows for the month at 10637 as it dropped by almost 400 points and in the process tagged the weekly VPOC of 10668 it had left in the second week of February 2019 and from where the auction had started a new IPM (click here to view the chart). The imbalance from 11147 to 10637 in four days then led to a retracement post IB on Friday as Nifty made multiple range extensions higher as it made a high of 10862 before closing the week at 10829 leaving an elongated weekly profile which was also an outside bar with overlapping weekly Value at 10918-11016-11075. In fact, Nifty has been forming a balance over the last 4 weeks (click here to view the composite) with the composite Value at 10832-11016-11144 so staying above 10832, the auction could remain in this balance in the coming week which would mark the end of the month also with 11016 as reference for the upside. However, staying below 10832, Nifty remains weak for a probe to 10715 & 10610.
Weekly Hypos for Nifty (Spot):
A) Nifty needs to sustain above 10817-832 for a move to 10863-884 & 10906-921
B) Staying below 10817, the auction could test 10799-782 / 10765-744 & 10713
C) Above 10921, Nifty can probe higher to 10947 / 10973-985 & 11016-35
D) Below 10713, lower levels of 10661 & 10637-610 could come into play
E) If 11035 is taken out & sustained, Nifty can have a fresh leg up to 11076-81 & 11130-144
F) Break of 10610 could bring lower levels of 10585 / 10563-558 & 10518-507
NF (Weekly Profile)
10842 [11152 / 10646]
Last week’s report ended with this ‘has a good chance of giving a move away from this balance provided it gets accepted above 11145 or below 10926 in the coming week‘ and this week NF opened on a strong note on Monday staying above the weekly POC and probed higher making a high of 11152 as it briefly got above the level of 11145 but was swiftly rejected and this led to a big trending move to the downside of more than 500 points over the next 4 days as the auction made a low of 10646 in the ‘A’ period on Friday before closing around the HVN of 10852 leaving an elongated weekly profile with the Value at 10656-10851-11019. NF has been forming a 4 week composite with Value at 10902-11061-11136 which will be the reference for the upside in the coming week if auction stays above 10851. The inability to sustain above 10851 would make the auction weak for a probe lower and could test the previous week’s low of 10646.
BankNifty Spot Weekly Profile (19th to 23rd August)
26959 [ 28469 / 26560 ]
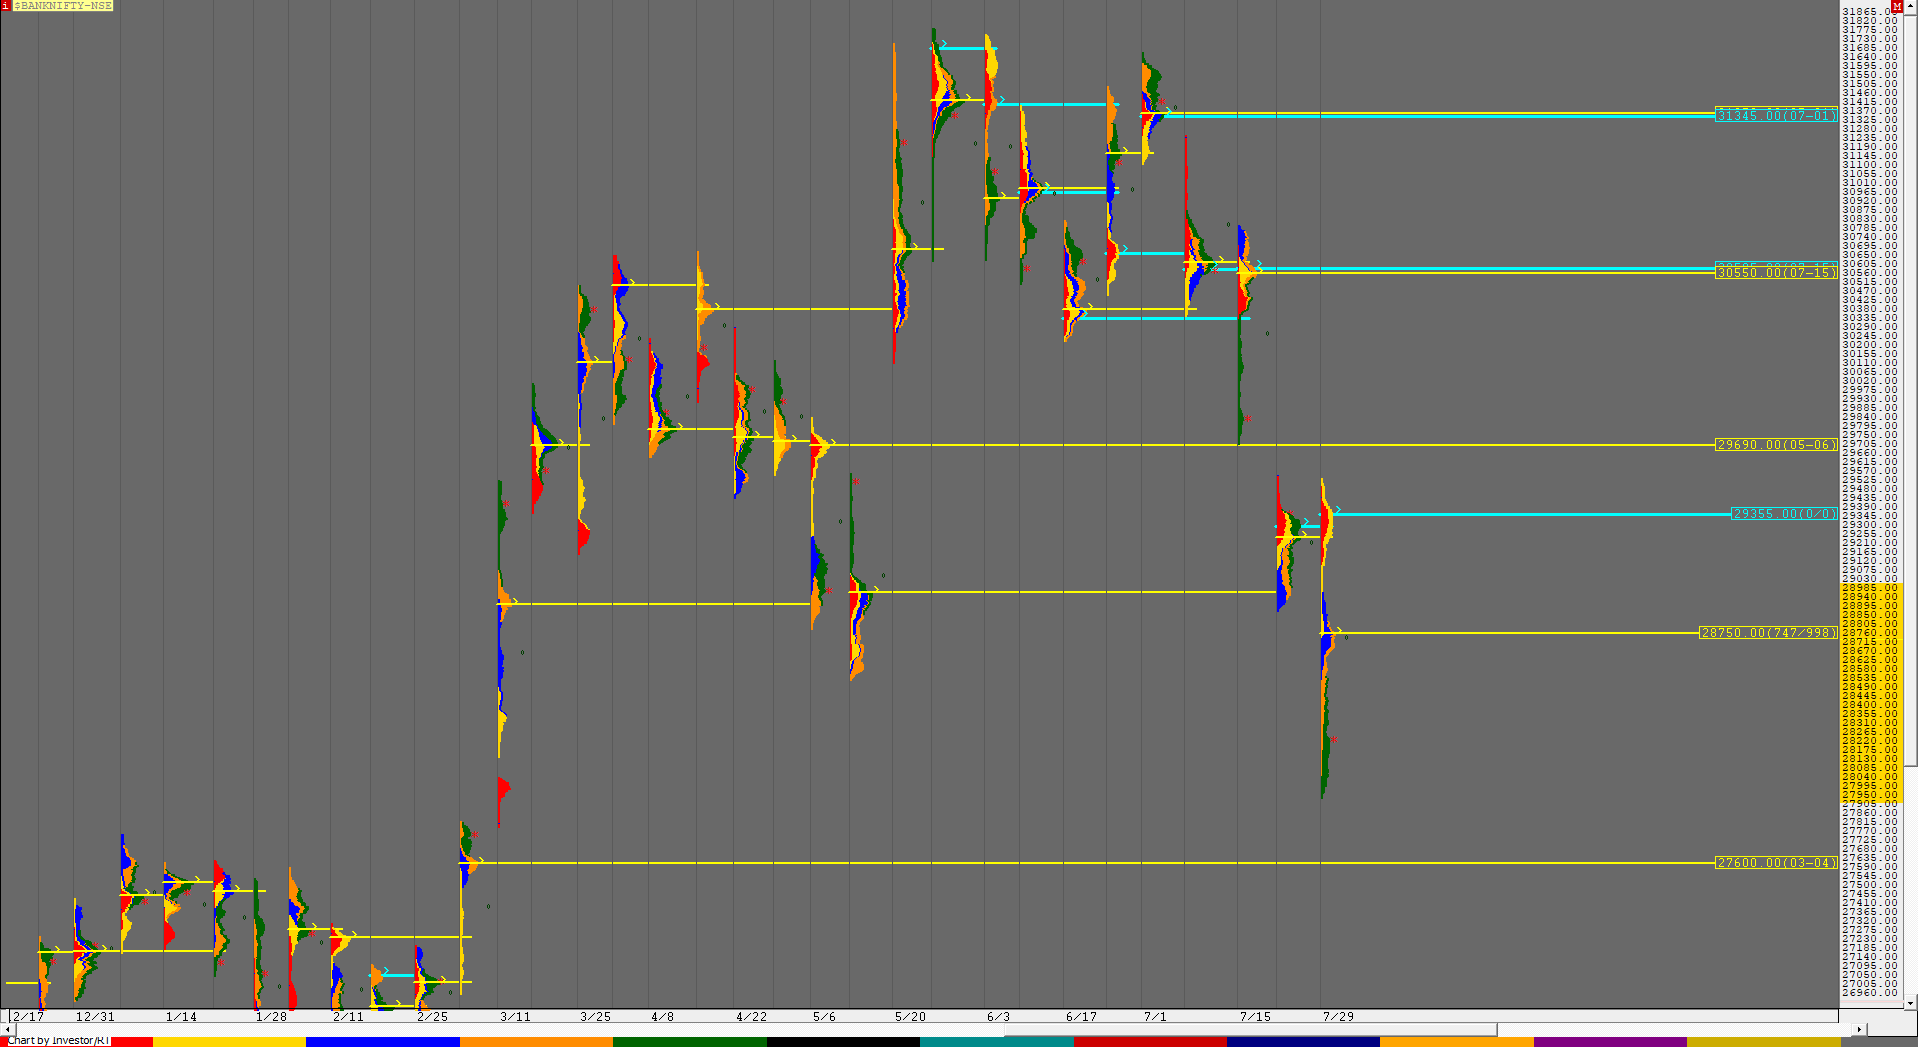
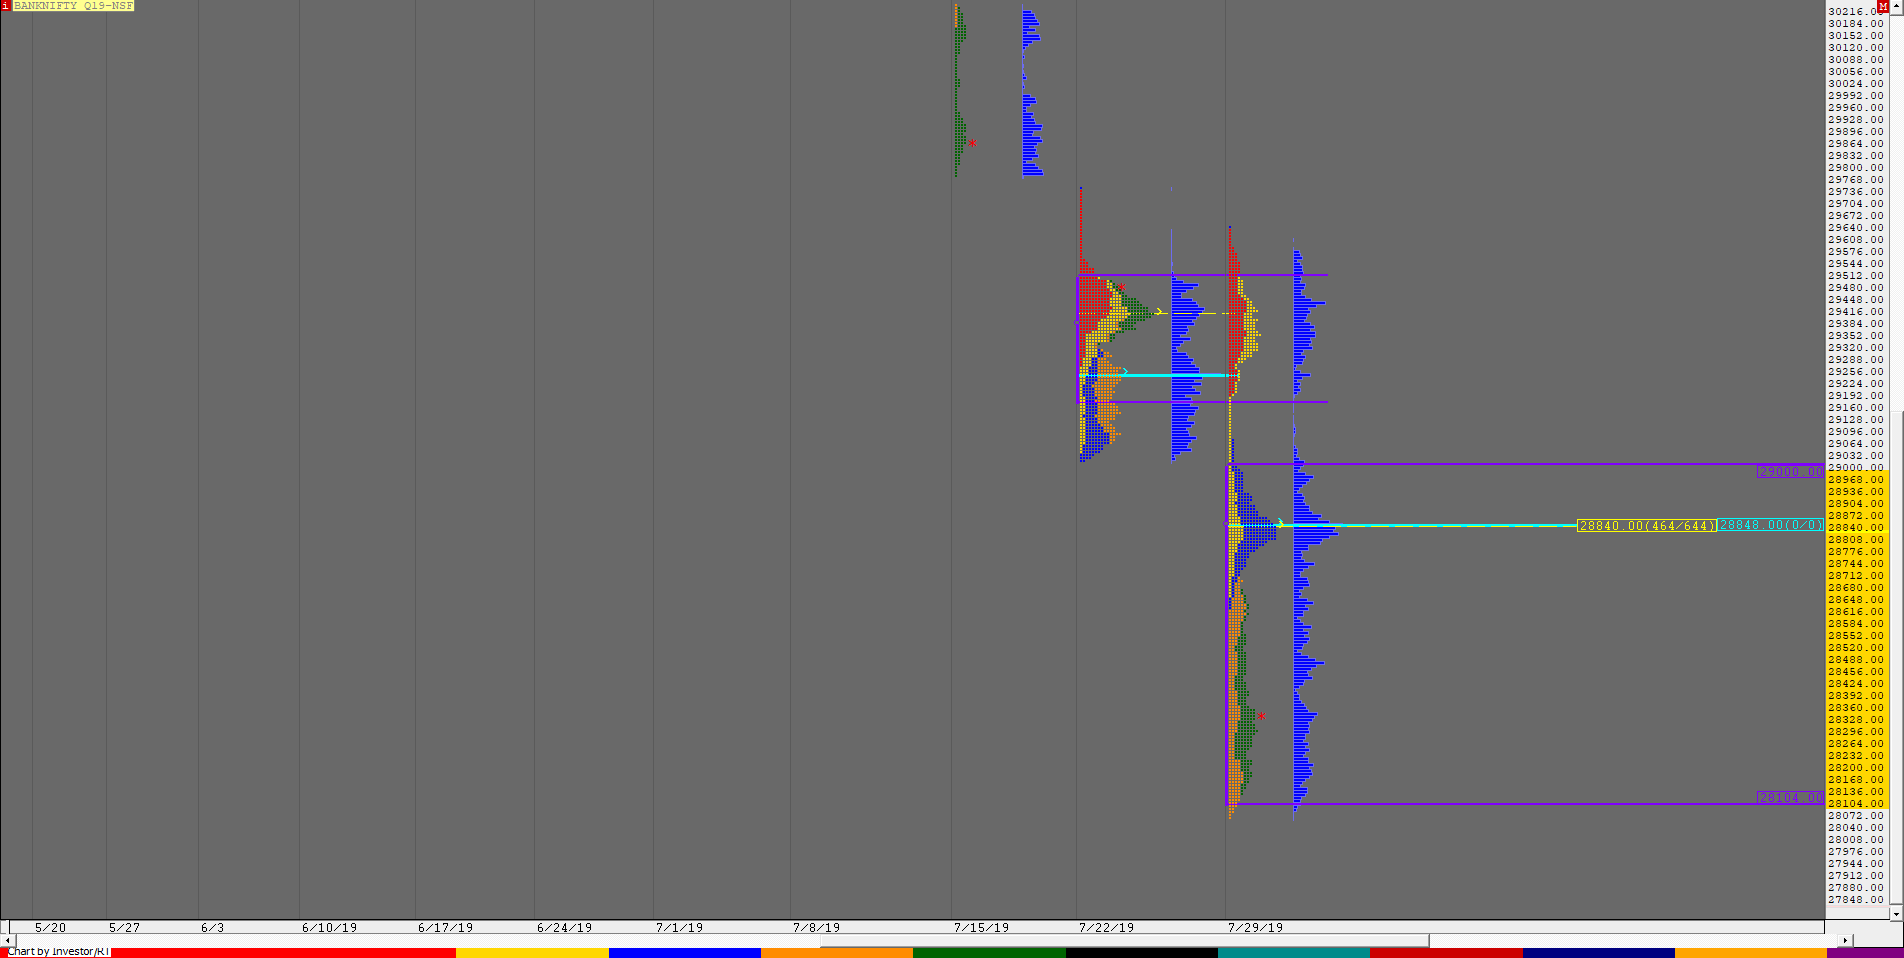
Similar to the Monday’s auction in Nifty, BankNifty also made a strong start to the week as it opened higher getting into the previous week’s selling tail of 28251 & negating it completely as it made a high of 28469 but was unable to sustain above IBH & went on to give a Neutral Extreme Day Down as it closed at 28186 after which it have a ORR start on Tuesday and made a 2 day balance below the lows of Monday forming a HVN at 27915 as it closed in a spike down on Wednesday. This spike not only got accepted but the auction went on to give a Open Drive down on Thursday with an OH start at 27690 and went on to trend lower falling by 1130 points as it made a low of 26560 on Friday morning leaving an extension handle at 27385. This imbalance in such a small time led to a retracement for the remaining part on Friday as BankNifty probed higher to tag 27207 where it got rejected before closing at 26959 leaving an elongated weekly profile with multiple distributions and Value at 27125-27915-28430. The auction has been forming a 3-week composite with Value at 27152-27915-28466 (Click here to view the composite) which will be the reference on the upside for the coming week.
Weekly Hypos for Bank Nifty (Spot):
A) BankNifty needs to sustain above 26980 for a move to 27060-70 / 27125-152 & 27205-225
B) Immediate support is at 26896-887 below which the auction can test 26814 / 26740-733 & 26651
C) Above 27225, BankNifty can probe higher to 27300-310 / 27385-390 & 27464
D) Below 26651, lower levels of 26570-545 / 26495-488 & 26441 could come into play
E) If 27464 is taken out, BankNifty could rise to 27535-570 / 27640-666 & 27725
F) Break of 26441 could trigger a move lower to 26407 / 26336-326 & 26244-230-190
G) Sustaining above 27725, the auction can tag higher levels of 27805-842 / 27890-915 & 27975
H) Staying below 26190, BankNifty can probe down to 26143-116 / 26080-65 / 26002-25985 / 25920
BNF (Weekly Profile)
27016 [ 28485 / 26615 ]
BNF has made an elongated weekly profile with overlapping to lower Value at 27168-27912-28472 as it gave a huge range of 1870 points and leaving an outside bar for this week.


