Nifty Feb F: 21823 [ 21844 / 21626 ]

| Open Type |
|---|
| ORR (Open Rejection Reverse) |
| Volumes of 13,375 contracts |
| Initial Balance |
|---|
| 162 points (21788 – 21626) |
| Volumes of 42,850 contracts |
| Day Type |
|---|
| Normal (‘p’ shape) – 218 pts |
| Volumes of 1,38,222 contracts |
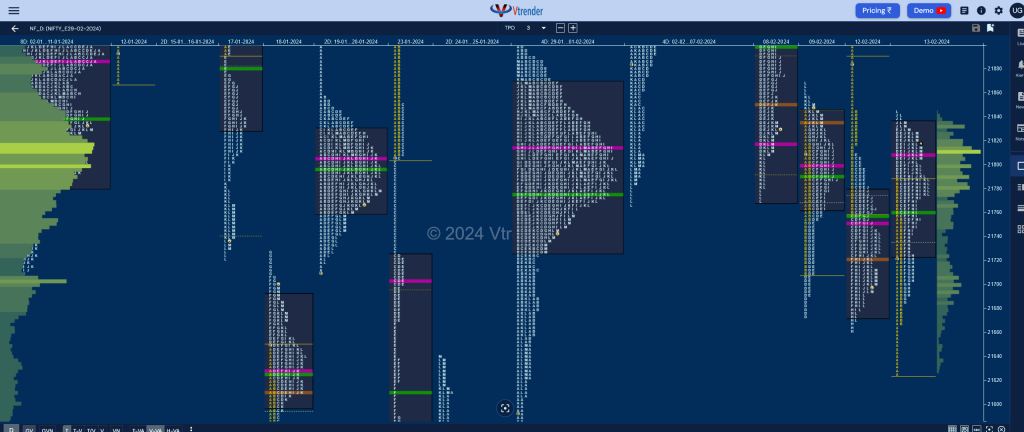
NF opened at previous day’s HVN of 21720 and probed higher getting rejected just below yVWAP of 21757 as it made a high of 21755 triggering a drop below previous low as it went in to hit 21626 but saw some demand coming back as it immediately got back into previous value promptly completing the 80% Rule while making new highs for the day at 21788 in the B period.
The auction consolidated in the C side forming an inside bar after which it made an extension to 21825 in the D TPO followed by marignal new highs of 21828 in the E hinting at short term exhaustion which led to a liquidation break below day’s VWAP as it made lower lows in the F & G periods leaving a PBL at 21684 taking support just above the A period buying tail from morning.
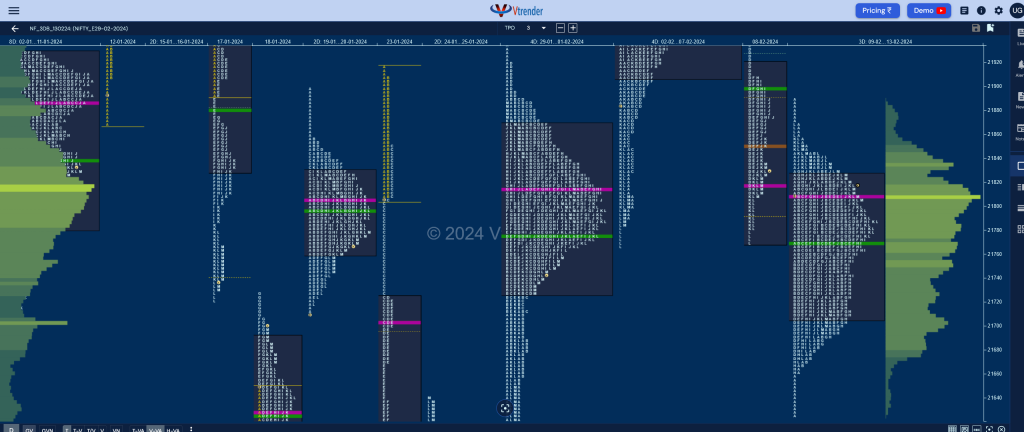
NF then went on to get back above VWAP in the H period resulting in higher highs in the I & J where it hit 21840 and gave an uncharacteristic pullback lower to 21774 in the K TPO before hinting at a spike higher into the close as it made new highs of 21844 in the L but could not get into the A period selling tail from previous session forcing a move back to the dPOC of 21808 into the close leaving overlapping value for the third consecutive day which gives us a 3-day composite with value at 21706-21808-21827 form where it could give a move away in the coming session(s).

Click here to view the latest profile in NF on Vtrender Charts
Daily Zones
- Largest volume (POC) was traded at 21808 F and VWAP of the session was at 21760
- Value zones (volume profile) are at 21724-21808-21836
- HVNs are at 21813 (** denotes series POC)
Weekly Zones
- Weekly Charts can be viewed here
- (29 Jan-01 Feb) – NF opened higher this week and remained above previous week’s VWAP of 21540 throughout even making a look up above the highs of 21916 but left a daily FA at 21920 forming overlapping value on all 4 days leaving a Neutral profile and a nice Gaussian Curve with completely higher Value at 21726-21813-21869 with a very prominent POC which will act as a magnet unless we get an initiative move away from here in the coming week
- (19-25 Jan) – NF has formed a Neutral Extreme weekly profile in a relatively large range of 21916 to 21287 with mostly lower Value at 21349-21416-21583 and also represents a Double Distribution shape with the upper HVN at 21804 and a small zone of singles in the middle of the profile from 21640 to 21670 seperating the lower distribution where it has also left a small buying tail at a prior weekly VPOC of 21296 (08-14 Dec) which will be the support zone for the coming week whereas on the upside, this week’s VWAP of 21540 will need to taken out and sustained for a move towards 21804 and the mini tail from 21908
Monthly Zones
- The settlement day Roll Over point (February 2024) is 21419
- The VWAP & POC of Jan 2024 Series is 21581 & 21635 respectively
- The VWAP & POC of Dec 2023 Series is 21226 & 21377 respectively
- The VWAP & POC of Nov 2023 Series is 19562 & 19806 respectively
Business Areas for 14th Feb 2024
| Up |
| 21845 – Selling Tail (12 Feb) 21897 – VWAP (08 Feb) 21950 – Ext Handle (08 Feb) 21986 – Ext Handle (08 Feb) 22031 – B TPO halfback (08 Feb) |
| Down |
| 21808 – 3-day POC (09-13 Feb) 21760 – VWAP from 13 Feb 21706 – 3-day VAL (09-13 Feb) 21666 – Buy tail (13 Feb) 21626 – PDL |
BankNifty Feb F: 45732 [ 46012 / 45011 ]

| Open Type |
|---|
| OAIR (Open Auction In Range) |
| Volumes of 17,118 contracts |
| Initial Balance |
|---|
| 608 points (45619 – 45011) |
| Volumes of 73,380 contracts |
| Day Type |
|---|
| Normal Variation – 1001 points |
| Volumes of 2,98,779 contracts |
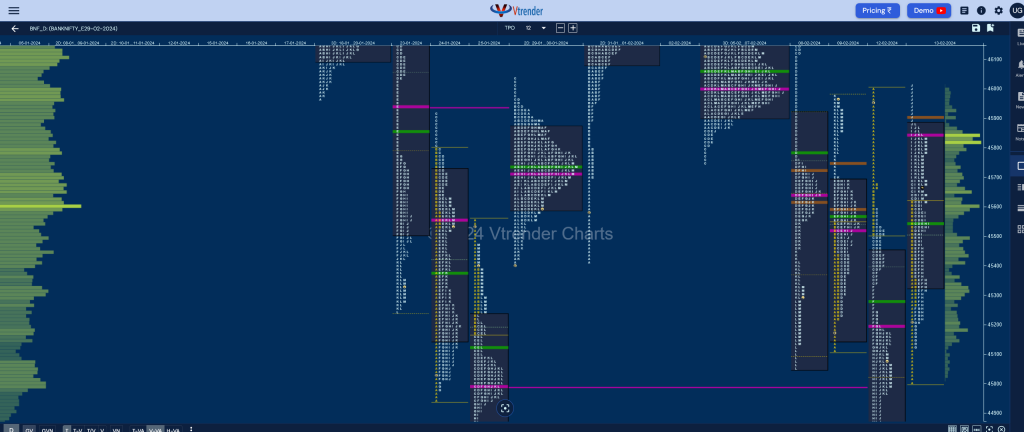
BNF opened at yPOC of 45201 and similar to NF was unable to get above yVWAP of 45279 as it made a high of 45240 and probed lower hitting the HVN of 45045 while making a low of 45011 where it found good demand coming back leading to a trending move higher for the rest of the IB (Initial Balance) as it not only got above yVWAP but went on to negate the extension handle of 45344 along with getting into the mid-profile singles from 45590 to 45660 which also it took out completely but with the dreaded C side extension to 45688.
The auction then made the mandatory trip back to day’s VWAP even breaking below it effectively in the E period retracing most of the upmove of the day as it got into the A period singles from morning and made a low of 45126 in the G TPO as the buyers came back to defend leaving a PBL there followed by a probe back above VWAP in the H fuelling a big upmove as it made a fresh RE (Range Extension) in the I hitting 45870 and followed it with a look up above PBH in the J where it tagged 46012.
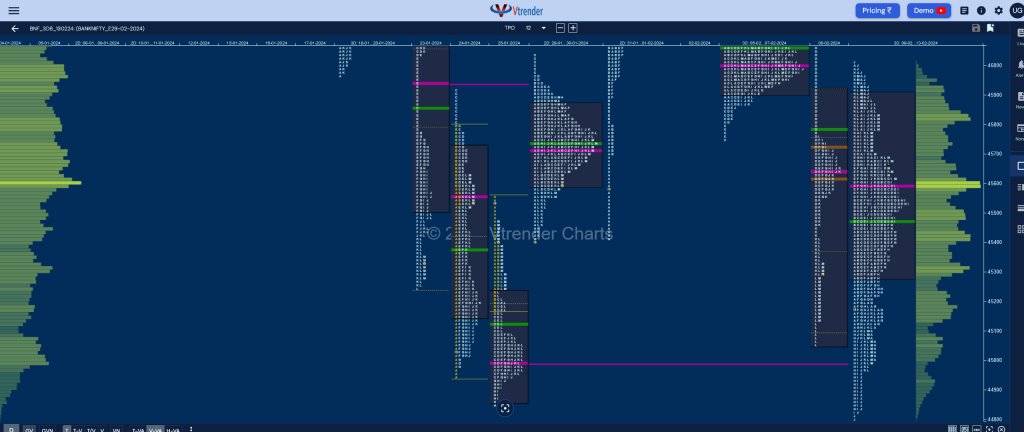
However, this move above PDH did not get any fresh demand triggering a profit booking drop into the close as BNF left a resposive selling tail till 45880 and went on to test the IBH of 45619 leaving a 3-1-3 profile for the day with the dPOC shifting to the top signaling longs booking out. We have a 3-day composite here also with Value at 45280-45597-45908 and it remains to be seen if we continue to build on this or give a move away in the coming session(s).

Click here to view the latest profile in BNF on Vtrender Charts
Daily Zones
- Largest volume (POC) was traded at 45849 F and VWAP of the session was at 45542
- Value zones (volume profile) are at 45331-45849-45883
- HVNs are at 45603** / 45998 / 46321 (** denotes series POC)
Weekly Zones
- Weekly Charts can be viewed here
- (01-07 Feb) – BNF has formed a Neutral Centre weekly profile as it first took support right at previous week’s VWAP of 45883 leaving a FA on 01st Feb and went on to make a trending move higher taking out the weekly selling tail of 19th-25th Jan profile and even tagged the prior week’s extension handle of 47115 but could only manage to tag 47145 as sellers came back strongly and went on to not only retrace the entire upmove but made new lows for the week at 45740 taking support just above previous week’s POC of 45717 and gave a bounce back to 46296 on the last day. Value for the week was mostly higher Value at 45897-46114-46410 with a prominent TPO HVN 45999 which will be the support for the coming week
- (29-31 Jan) – BNF took support multiple times at previous week’s VWAP of 45492 forming a Neutral Extreme weekly profile to the upside giving a move away from the prominent POC of 45717 on the last day where it went on to hit new highs of 46444 forming overlapping to higher Value at 46429-45717-45994 but this week’s NeuX VWAP of 45883 will be the important reference going forward if it has to continue higher towards the selling tail from 46720 & extension handle of 47115 in the coming week
- (19-25 Jan) – BNF has also formed a Neutral Extreme weekly profile in a range of 46892 to 44851 with completely lower Value at 44903-44997-45626 but has seen the POC shift to the lows hinting at profit booking by sellers so can give a bounce with this week’s VWAP of 45492 being an important reference for the buyers to take out in case of the upmove to continue in the new series
Monthly Zones
- The settlement day Roll Over point (February 2024) is 44999
- The VWAP & POC of Jan 2024 Series is 46353 & 48119 respectively
- The VWAP & POC of Dec 2023 Series is 47337 & 47918 respectively
- The VWAP & POC of Nov 2023 Series is 43837 & 43619 respectively
Business Areas for 14th Feb 2024
| Up |
| 45780 – LVN from 13 Feb 45946 – Selling tail mid (13 Feb) 46116 – Ext Handle (08 Feb) 46260 – HVN from 08 Feb 46387 – Selling Tail (08 Feb) 46475 – Swing High (08 Feb) |
| Down |
| 45698 – M TPO VWAP 45542 – VWAP from 13 Feb 45376 – H TPO halfback 45202 – G TPO VWAP 45068 – IB singles mid (13 Feb) 44955 – LVN from 12 Feb |
You can check the monthly charts & other swing levels for both Nifty & BankNifty here & for the weekly charts & analysis, please click here.
