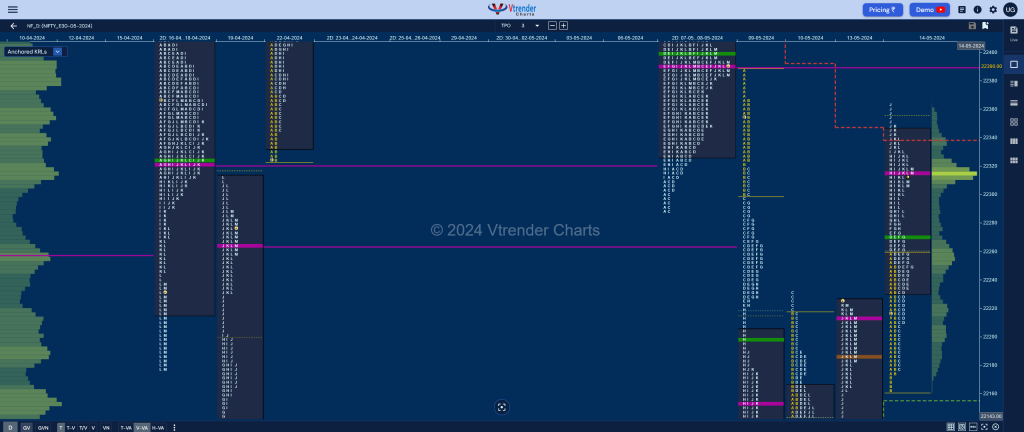
Nifty May F: 22308 [ 22364 / 22160 ]

| Open Type |
|---|
| OA (Open Auction) |
| Volumes of 32,200 contracts |
| Initial Balance |
|---|
| 100 points (22260 – 22160) |
| Volumes of 72,517 contracts |
| Day Type |
|---|
| Trend – 205 pts |
| Volumes of 2,66,745 contracts |
to be updated…
Click here to view the latest profile in NF on Vtrender Charts
Daily Zones
- Largest volume (POC) was traded at 22315 F and VWAP of the session was at 22270
- Value zones (volume profile) are at 22231-22315-22345
- NF has immediate supply point at AVWAP of 22339 from Swing High of 22888 from 03/05
- NF has immediate support at AVWAP of 22155 from Swing Low of 21900 from 13/05
- NF confirmed a FA at 22230 on 10/04 and completed the 1 ATR objective of 22000 on 13/05. This FA was revisted on 14/05 and has closed above so is no longer a valid reference.
- NF confirmed a FA at 21900 on 13/04 and completed the 2 ATR objective of 22343 on 14/05.
- NF confirmed a FA at 22977 on 09/04 and has not been tagged hence is a postional swing level
- HVNs are at NA (** denotes series POC)
Weekly Zones
- Weekly Charts can be viewed here
- (19-25 Apr) – to be updated…
Monthly Zones
- The settlement day Roll Over point (May 2024) is 22648
- The VWAP & POC of Apr 2024 Series is 22386 & 22457 respectively
- The VWAP & POC of Mar 2024 Series is 22168 & 22001 respectively
- The VWAP & POC of Feb 2024 Series is 21956 & 21930 respectively
Business Areas for 15th May 2024
| Up |
| 22315 – POC (14 May) 22349 – Sell tail (14 May) 22390 – VPOC (08 May) 22453 – I TPO VWAP (08 May) 22501 – B TPO VWAP (07 May) |
| Down |
| 22270 – VWAP (14 May) 22230 – Weekly IBH 22185 – HVN (13 May) 22140 – Ext Handle (13 May) 22101 – H TPO VWAP (13 May) |
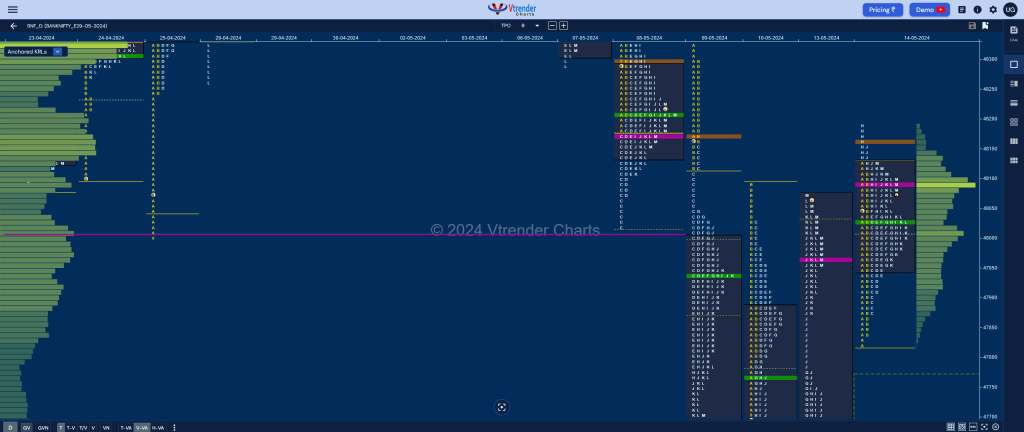
BankNifty May F: 48091 [ 48225 / 47825 ]

| Open Type |
|---|
| OA (Open Auction) |
| Volumes of 17,514 contracts |
| Initial Balance |
|---|
| 298 points (48123 – 47825) |
| Volumes of 38,476 contracts |
| Day Type |
|---|
| Normal – 400 pts |
| Volumes of 1,15,093 contracts |
to be updated…
Click here to view the latest profile in BNF on Vtrender Charts
Daily Zones
- Largest volume (POC) was traded at 48093 F and VWAP of the session was at 48025
- Value zones (volume profile) are at 47947-48093-48126
- BNF has immediate supply point at AVWAP of 48583 from Swing High of 49927 from 30/04
- BNF has immediate support at AVWAP of 47778 from Swing Low of 47200 from 13/05
- BNF confirmed a FA at 47200 on 13/04 and completed the 1 ATR objective of 47813 on the same day. The 2 ATR target comes to 48425.
- HVNs are at NA (** denotes series POC)
Weekly Zones
- Weekly Charts can be viewed here
- (25-30 Apr) – to be updated…
- (18-24 Apr) – to be updated…
Monthly Zones
- The settlement day Roll Over point (May 2024) is 48360
- The VWAP & POC of Apr 2024 Series is 47971 & 47994 respectively
- The VWAP & POC of Mar 2024 Series is 47051 & 47300 respectively
- The VWAP & POC of Feb 2024 Series is 46119 & 45700 respectively
Business Areas for 15th May 2024
| Up |
| 48126 – Closing PBH (14 May) 48225 – PDH 48360 – RO point 48416 – VPOC (07 May) 48553 – VWAP (07 May) |
| Down |
| 48072 – M TPO low (14 May) 47960 – PBL (14 May) 47838 – Buy Tail (14 May) 47723 – J TPO h/b (13 May) 47628 – NeuX VWAP (13 May) |
You can check the monthly charts & other swing levels for both Nifty & BankNifty here & for the weekly charts & analysis, please click here.
