Nifty Mar F: 21910 [ 21988 / 21798 ]

| Open Type |
|---|
| OAIR (Open Auction In Range) |
| Volumes of 11,071 contracts |
| Initial Balance |
|---|
| 121 points (21963 – 21842) |
| Volumes of 35,841 contracts |
| Day Type |
|---|
| Neutral Centre – 191 pts |
| Volumes of 1,37,718 contracts |
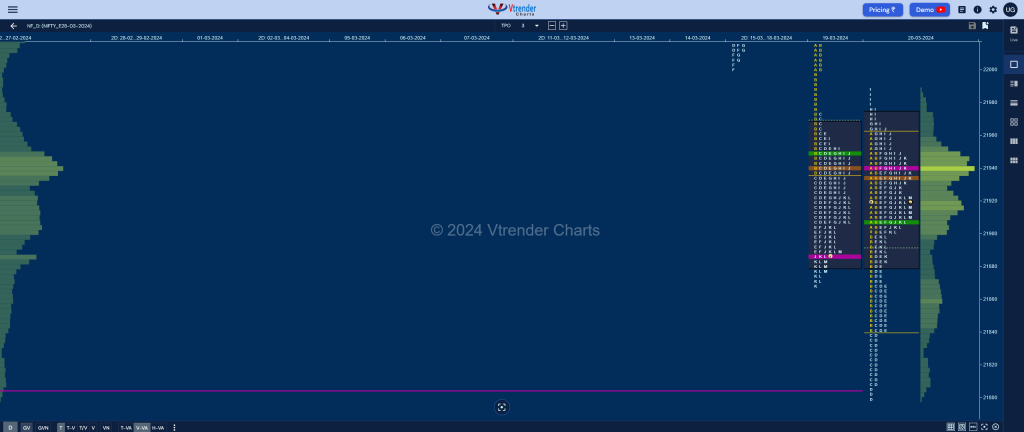
NF opened higher and went on to test yVWAP of 21949 while making a high of 21963 in the A period but could not get above yVAH of 21967 triggering the 80% Rule being implemented in the B TPO where it left an extension handle at 21900 and went on to make new lows for the series at 21842 getting into 14th Feb’s profile.
The auction then made couple of REs in the C & D periods tagging the VPOC of 21799 as it made a low of 21798 marking the end of the downside as it not only got back into the IB but went on to complete the 80% Rule in previous Value to the upside even making a trifecta of REs from the G to I TPOs as it got into 19th Mar’s B period singles from 21972 to 22001 but could only manage to tag 21988 leaving a small responsive selling tail at the top.
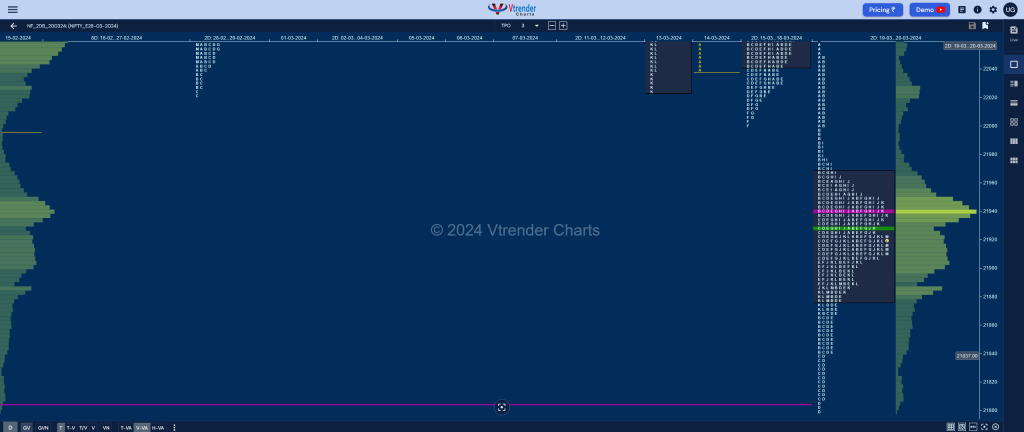
NF then made it a hat-trick of playing out the 80% Rule in previous Value again to the downside as it went on to make a low of 21882 in the K TPO before settling down to close right at day’s VWAP leaving a perfect Neutral Centre Day with completely overlapping Value hence giving a nice 2-day balance with Value at 21878-21939-21968 and will most probably start a fresh imbalance from here.

Click here to view the latest profile in NF on Vtrender Charts
Daily Zones
- Largest volume (POC) was traded at 21941 F and VWAP of the session was at 21907
- Value zones (volume profile) are at 21881-21941-21975
- NF confirmed a FA at 22018 on 18/03. This FA was broken on 19/03 and tagged the 1 ATR target on downside of 21808 on 20/03
- HVNs are at 22393 / 22443** / 22497 / 22596 (** denotes series POC)
Weekly Zones
- Weekly Charts can be viewed here
- (08-14 Mar) – NF has formed a Double Distribution Trend Down profile on the weekly as it left an initiative selling tail at previous week’s VAH and went on to probe lower swiping through the Value Areas of last couple of weeks tagging the 23-29 Feb’s VPOC of 22113 and made a low of 22025 taking support just above the daily FA of 22022 from 29th Feb. Value for the week was overlapping on both sides at 22286-22442-22593 with the VWAP at 22316 which will be the immediate supply point for the new week
- (01-07 Mar) – NF opened the week with an initiative probe to the upside right from the Mar RO point of 22188 as it left a buying tail from 22259 to 22180 and went on to record similar highs of 22547 & 22545 triggering a round of profit booking as it made a retracement down to 22322 taking support just above previous week’s VAH of 22293 and saw demand coming back resulting in a fresh imbalance and new ATH of 22620 but lack of fresh buying led to another round of profit booking as the auction came down to 22526 before closing the week at 22552 leaving a Normal Variation profile with completely higher Value at 22335-22443-22551 with the VWAP at 22452.
Monthly Zones
- The settlement day Roll Over point (March 2024) is 22188
- The VWAP & POC of Feb 2024 Series is 21956 & 21930 respectively
- The VWAP & POC of Jan 2024 Series is 21581 & 21635 respectively
- The VWAP & POC of Dec 2023 Series is 21226 & 21377 respectively
Business Areas for 21st Mar 2024
| Up |
| 21917 – M TPO VWAP 21968 – 2-day VAH (19-20 Mar) 22001 – Ext Handle (19 Mar) 22048 – Sell Tail (19 Mar) 22094 – VPOC (18 Mar) 22138 – 2-day VPOC (15-18 Mar) |
| Down |
| 21908 – VWAP (20 Mar) 21868 – SOC (20 Mar) 21808 – SOC (20 Mar) 21753 – DSL (14 Feb) 21713 – DSL (31 Jan) 21681 – Weekly ATR |
BankNifty Mar F: 46449 [ 46777 / 46364 ]

| Open Type |
|---|
| OAIR (Open Auction In Range) |
| Volumes of 11,637 contracts |
| Initial Balance |
|---|
| 433 points (46699 – 46266) |
| Volumes of 46,053 contracts |
| Day Type |
|---|
| Neutral Centre – 788 points |
| Volumes of 2,31,533 contracts |
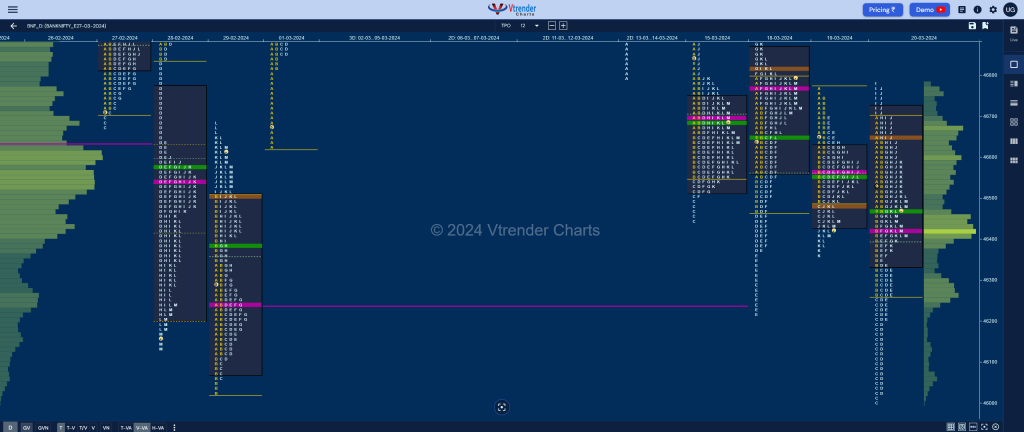
BNF opened higher right at the HVN of 46477 and made the first probe higher as it looked above previous Value making a high of 46699 but could not sustain as the sellers came back and not only did the 80% Rule but went on to leave an extension handle at 46462 and broke below PDL to hit 46266 in the IB.
The auction then made a big C side probe down breaking below the couple of Swing lows of 46210 and 46030 from 18th Mar & 29th Feb respectively as it hit 46002 but typical of the C side character got back into the IB and even scaled above day’s VWAP triggering a short covering bounce which even resulted in a RE to the upside in the I TPO where it made new highs of 46789.
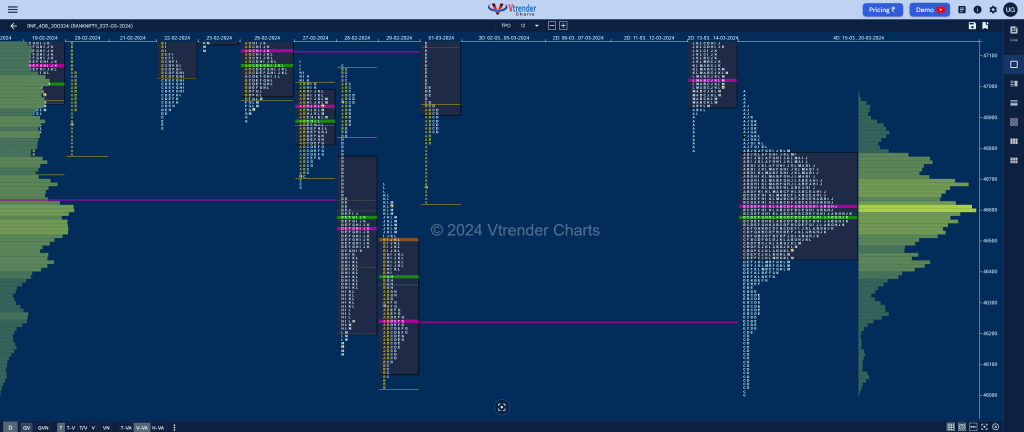
BNF rejected the probe above PDH swiftly indicating supply coming back strongly who then took it back into previous value doing the 80% Rule once again while leaving a PBL at 46376 in the K period before settling down around VWAP leaving a Neutral Centre Day and an outside bar both in terms of range & value. We now have a 4-day composite balance with Value at 46449-46612-46787 and the close is right at the VAL with high also exactly at VAH so seems ready for a move away from here in the coming session(s).

Click here to view the latest profile in BNF on Vtrender Charts
Daily Zones
- Largest volume (POC) was traded at 46419 F and VWAP of the session was at 46467
- Value zones (volume profile) are at 46340-46419-46720
- BNF confirmed a FA at 47684 on 13/03 and tagged the 2 ATR objective of 46442 on 15/03. This FA is currently on ‘T+6’ Days
- HVNs are at 47521** / 48217 (** denotes series POC)
Weekly Zones
- Weekly Charts can be viewed here
- (14-20 Mar) – The weekly profile is a Normal Varation one to the downside representing a composite ‘b’ shape with completely lower Value at 46361-46612-46867 with the VWAP being at 46690 and has a rather prominet TPO POC from where it could give a move away in the last weekly settlement of this series
- (07-13 Mar) – BNF has formed an inside bar on the weekly with overlapping to lower value at 47000-47518-47593 and is a Trend Down one which has moved away to the downside from the prominent POC of 47518 so this week’s VWAP of 47600 will now be the swing reference for the coming week
- (01-06 Mar) – BNF left a Trend Up weekly profile hitting the 2 IB target of 48343 forming completely higher value at 47444-47567-48229 with a closing HVN at 48217 which will be the immediate reference on the upside in the coming week staying above which it could go for the higher VPOC of 48480 and HVN of 48864 from the weekly profile of 11th to 17th Jan whereas on the downside, this week’s VWAP of 47694 will be an important swing support.
Monthly Zones
- The settlement day Roll Over point (March 2024) is 46610
- The VWAP & POC of Feb 2024 Series is 46119 & 45700 respectively
- The VWAP & POC of Jan 2024 Series is 46353 & 48119 respectively
- The VWAP & POC of Dec 2023 Series is 47337 & 47918 respectively
Business Areas for 21st Mar 2024
| Up |
| 46467 – VWAP (20 Mar) 46612 – 4-day POC (15-20 Mar) 46787 – 4-day VAH (15-20 Mar) 46940 – A TPO POC (15 Mar) 47024 – VPOC (14 Mar) 47199 – I TPO halfback (14 Mar) |
| Down |
| 46449 – 4-day VAL (15-20 Mar) 46292 – E TPO VWAP (20 Mar) 46161 – SOC (20 Mar) 46022 – Buy tail (20 Mar) 45900 – HVN (14 Feb) 45705 – C low (14 Feb) |
