Nifty Spot: 21982 [ 22297 / 21530 ]
Previous month’s report can be viewed here

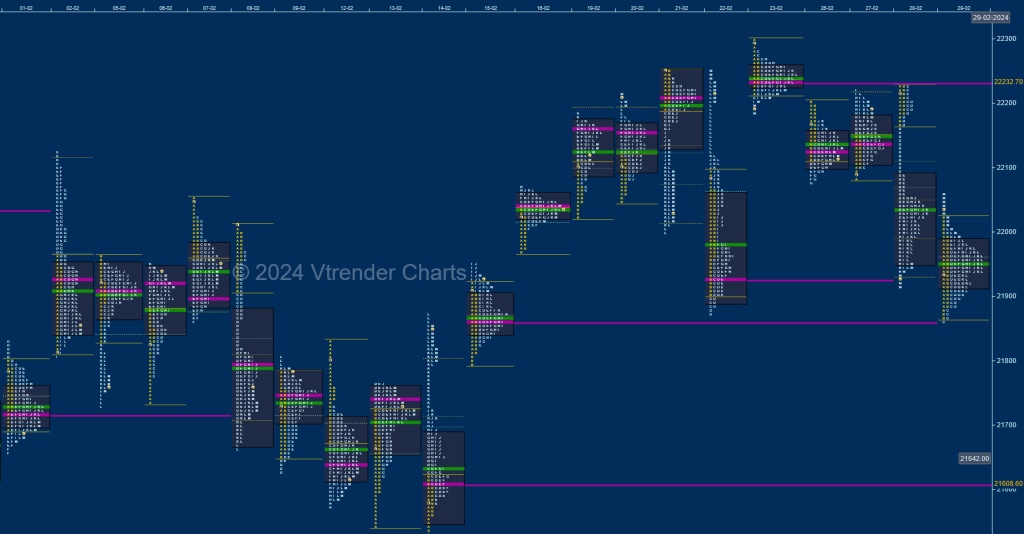
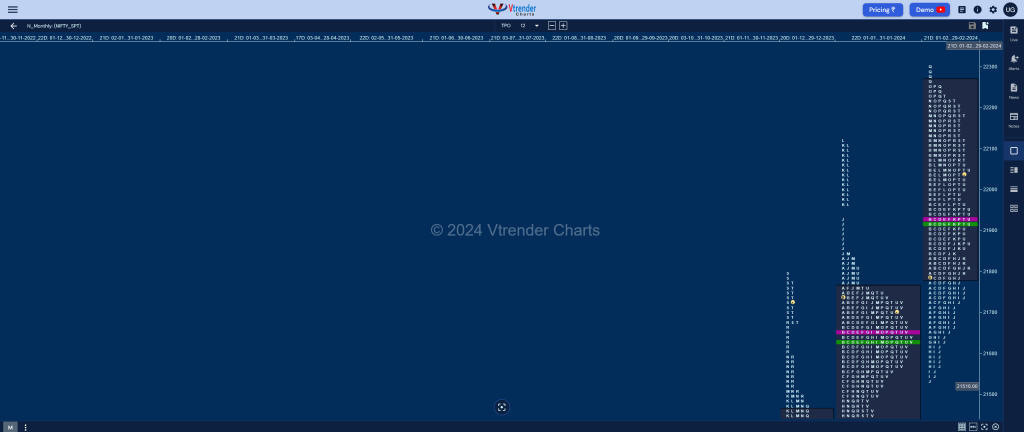
Nifty has formed a well balanced monthly profile as it remained well above the Rollover point of 21419 but displayed two way auction mode all of February where it made a low of 21530 on the 14th leaving an initiative buying tail till 21558 and climbed back above January’s series VWAP of 21581 and POC of 21635 making way for a trending move higher as it went on to record new ATH of 22297 on 23rd but left a small A period selling tail marking the end of the upmove as it went on to give a retracment back to 15th Feb’s VPOC of 21861 and left a FA (Failed Auction) right there on the last day closing the month with a Neutral profile both on daily as well as monthly where it has formed completely higher Value at 21791-21930-22261 with this series VWAP being at 21956 so looks good for upside with initial targets of 22077 & 22294 being the 1 & 2 ATR objectives from the FA of 21860 which will be the important Swing reference for the coming month of March below which we have the TPO HVN of 21741 as lower level to watch.

Monthly Zones
- The settlement day Roll Over point (March 2024) is 22188
- The VWAP & POC of Feb 2024 Series is 21956 & 21930 respectively
- The VWAP & POC of Jan 2024 Series is 21581 & 21635 respectively
- The VWAP & POC of Dec 2023 Series is 21226 & 21377 respectively
- The VWAP & POC of Nov 2023 Series is 19652 & 19806 respectively
- The VWAP & POC of Oct 2023 Series is 19468 & 19537 respectively
- The VWAP & POC of Sep 2023 Series is 19736 & 19672 respectively
BankNifty Spot: 46121 [ 47363 / 44633 ]
Previous month’s report can be viewed here

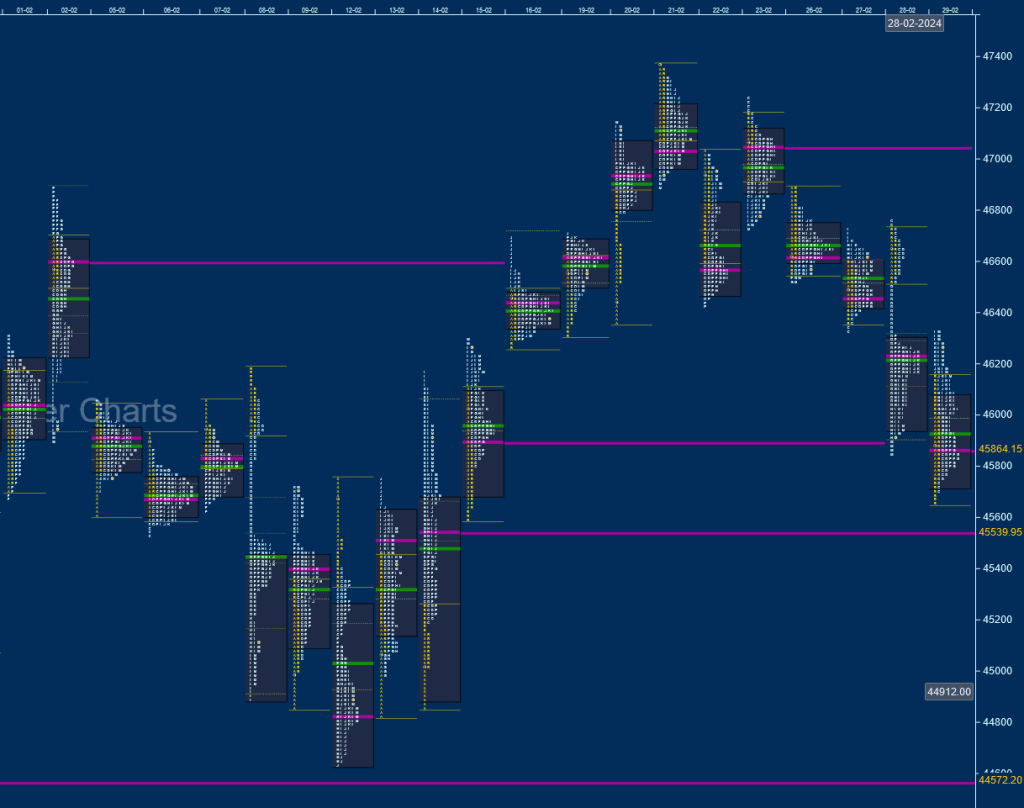
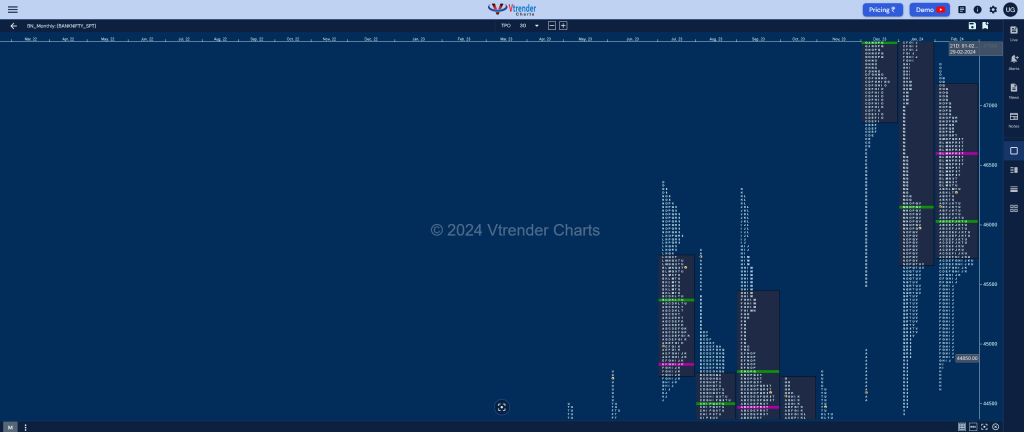
BankNifty has formed an inside bar both in terms of range as well as value this month as it filled up January’s DD (Double Distribution) zone from 46580 to 47010 and in the process left a 3-1-3 Neutral Centre monthly profile for February closing right at the series VWAP of 46119. Value as mentioned before was completely inside at 45650-45700-47169 with a buying tail from 44819 to 44634 as it took support just above the daily VPOC of 44572 from 25th Jan and went on to hit 47363 on 21st Feb marking the highs of the month after which it left couple of daily FAs (Failed Auction) at 47245 & 46754 on 23rd & 28th respectively and promptly completed the 2 ATR objective of 45758 from the former while making a low of 45661 on the last day of the month where it left a small initiative buying tail just above 15th Feb’s singles triggering a probe back to 46329. The larger timeframe balance seen in BankNifty could lead to an imbalance in the month of March provided it can sustain above the Roll Over point of 46610 with the 2 FAs of 46754 & 47245 being the immediate objectives on the upside above which it could go for January’s monthly VPOC of 48119 and the pair of weekly VPOCs of 48312 & 48492 whereas on the downside would get weak below 46119 with minor supports at 45920 & 45700 and a break of which could lead to a test of this month’s buying tail and a further test of November’s VAH of 44139.

Monthly Zones
- The settlement day Roll Over point (March 2024) is 46610
- The VWAP & POC of Feb 2024 Series is 46119 & 45700 respectively
- The VWAP & POC of Jan 2024 Series is 46353 & 48119 respectively
- The VWAP & POC of Dec 2023 Series is 47337 & 47918 respectively
- The VWAP & POC of Nov 2023 Series is 43837 & 43619 respectively
- The VWAP & POC of Oct 2023 Series is 43716 & 44346 respectively
- The VWAP & POC of Sep 2023 Series is 44438 & 44808 respectively
