Nifty Sep Spot: 19638 [ 20222 / 19255 ]
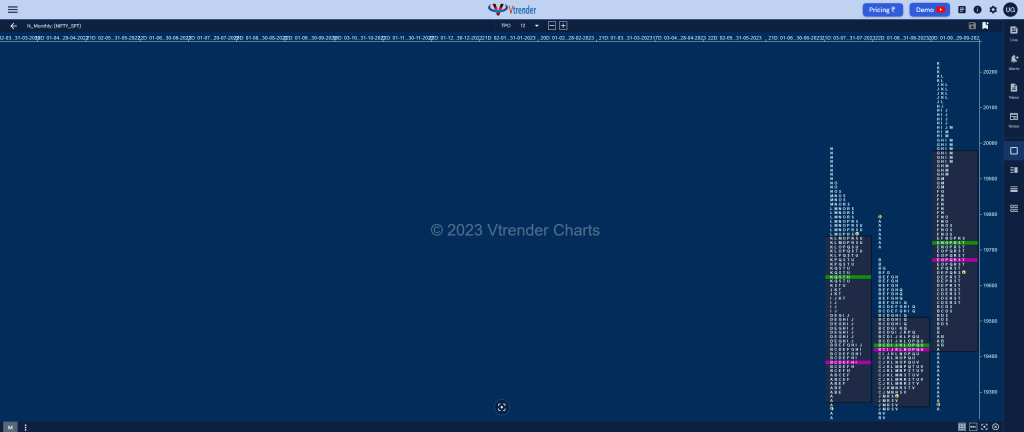
Previous month’s report ended with this ‘The monthly profile is a Normal one and a ‘b’ shape long liquidation type with an initiative selling tail from 19645 to 19795 which has formed completely inside Value at 19263-19424-19503 which has kind of filled up previous month’s low volume zone of the DD (Double Distribution) Trend Up profile which also means that the imbalance to balance phase is complete or nearing completion thus making a good chance for a fresh imbalance to begin in September with this month’s POC & VWAP of 19424 & 19440 being the references on the upside above which Nifty could go for a test of the selling extension handle of 19509 and the SOC of 19548 from 24th Aug whereas on the downside, July’s buying tail from 19300 to 19189 continues to be the zone to watch and a break of which on a closing basis can have big downside moves open with the 30th Jun’s weekly extendion handle of 18886 being the initial objective‘

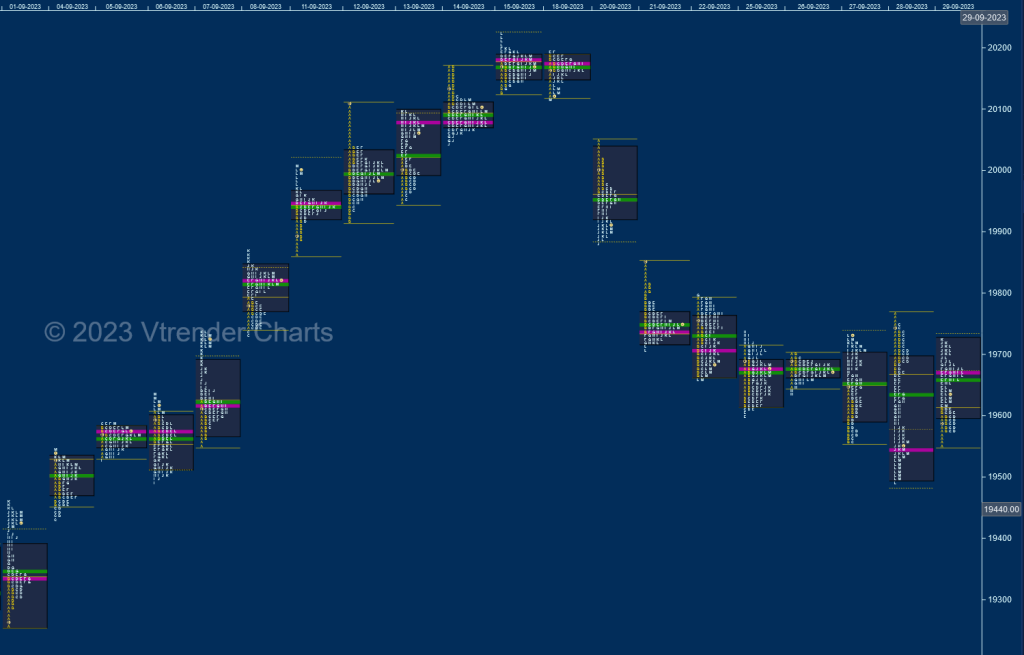
Nifty opened the month with an initiative buying tail from 19288 to 19255 and left a hat-trick of extension handles at 19350 / 19373 & 19406 leaving a Double Distribution (DD) Trend Day Up making it clear that the fresh imbalance had begun which was further confirmed by a FA (Failed Auction) it left at 19432 on 04th forming a Neutral Extreme (NeuX) Up profile with a close above previous month’s VAH of 19503 and went on to complete the 2 ATR objective of 19709 with another DD on the 07th where it left a extension handle at 19652 and once again followed it with a NeuX profile on 08th Sep leaving the second FA for the month at 19727 and swiped through the monthly selling singles from August making a look up above it as it hit 19867.
The upside imbalance gained more momentum in the second week as the auction not only negated the July selling singles from 19887 to 19992 but scaled above 20000 for the first time even and went on to hit higher highs all through the week except for an inside day on 13th Sep which was incidentally the 3rd DD of the month followed by higher highs of 20167 and 20222 on the last 2 days but left a small responsive selling tail at top giving the first cue that the upside may be getting stalled.
More confirmation of the IPM (Initial Price Movement) coming to an end came at the start of the third week as Nifty formed a Neutral Day with a FA at highs of 20195 and made a lower low on the daily only for the second time in the month which was followed by a huge liquidation drop of 538 points with the help of a big gap down open on 20th where it not only left an A period selling tail from 20017 but also an extension handle at 19927 to leave a DD on the downside after which it closed the week with a 2-day composite ‘b’ shape profile with another A period singles from 19812 and a second FA on the upside at 19798.
The last week of the month saw the completion of the 2 ATR objective of 19517 from the FA of 19798 while making a low of 19492 on the 28th with a huge 275 point range Trend Day Down but seemed like the selling climax as the dPOC shifted lower to 19542 into the close after which the last day of the month not only opened above it but left a small A period buying tail to fill up the previous profile forming an inside bar and closing the month with yet another DD.

The monthly profile is an elongated 967 point range one with overlapping to higher Value at 19421-19675-19973 and has a buying tail from 19432 to 19255 along with an extension handle at 19458 which will be the swing zone for the coming month with the first layer of support at 19491 whereas on the upside, we have a low volume zone from 19728 to 20129 which Nifty can fill up provided it sustains above the September monthly POC & VWAP of 19675 & 19727 respectively with the higher references being this month’s SOC of 20129 & the FA of 20195.
Monthly Zones
- The settlement day Roll Over point (October 2023) is 19635
- The VWAP & POC of Sep 2023 Series is 19736 & 19672 respectively
- The VWAP & POC of Aug 2023 Series is 19440 & 19424 respectively
- The VWAP & POC of Jul 2023 Series is 19600 & 19430 respectively
- The VWAP & POC of Jun 2023 Series is 18739 & 18707 respectively
- The VWAP & POC of May 2023 Series is 18232 & 18270 respectively
- The VWAP & POC of Apr 2023 Series is 17656 & 17631 respectively
BankNifty Sep Spot: 44584 [ 46310 / 43830 ]
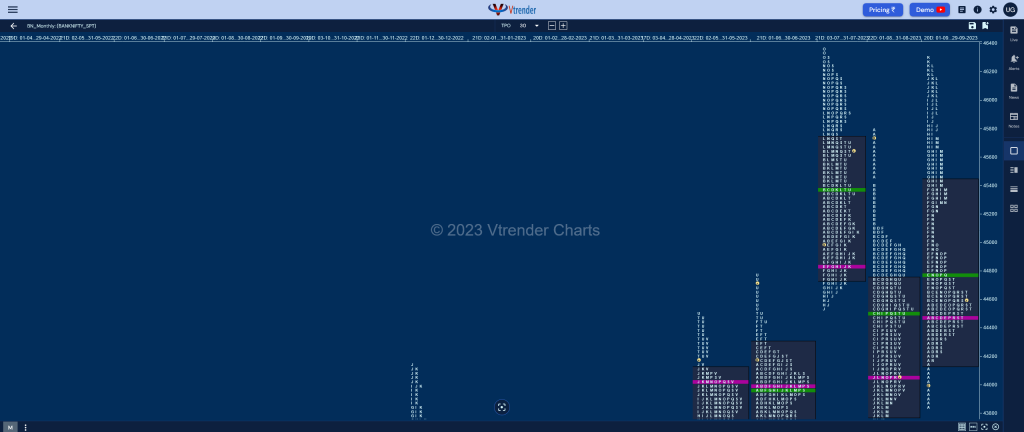
Previous month’s report ended with this ‘The monthly profile is a long liquidation ‘b’ shape one with mostly lower Value at 43777-44550-44753 and has a long selling tail from 45118 to 45782 which will be a positional zone to watch on the upside in the coming month with the daily VPOCs of 44611 & 44985 being the other levels in between where as on the downside, the prominent weekly POC of 43863 will be the immediate support below which the small responsive buying tail at the lows from 43672 to 43600 will be the zone to watch below which 43541 & 43390 would be the swing support levels and a break of which could trigger a move towards the April 2023 VPOC of 42910 as the auction could continue to fill up the area between these 2 references before giving a move away in September where it more often gives a big move than not‘

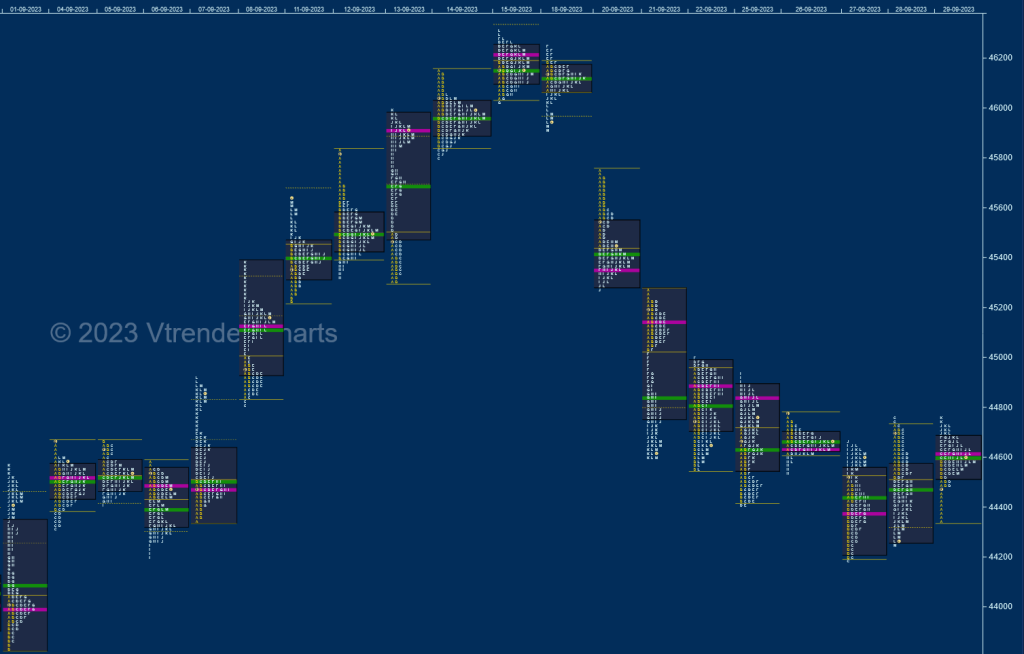
BankNifty opened the month with a test of the prominent weekly POC of 44863 but left a small but important buying tail from 43870 to 43830 and went on to form a Double Distribution Trend Day Up after leaving an extension handle at 44139 after which it formed a nice balance for the next four days (04th to 07th Sep) building a prominent POC at 44467 before giving another extension handle at 44690 to signal a fresh probe higher which was followed by a Neutral Extreme Day Up on 08th Sep where it confirmed a FA at 44812 and went on to hit new highs of 45383 completing the 1 ATR objective of 45232 in the process.
The auction continued to make higher highs all of next week (11th to 15th Sep) not only completing the 2 ATR target of 45651 but scaled above previous month’s selling tail high of 45782 and went on to tag the weekly FA of 46310 from 27th Jul to the dot stalling right there as it closed the day as a Neutral Centre on the 15th recording the narrowest daily range for the month of just 282 points indicating poor trade facilitation and exhaustion on the upside.
The next week started with a Neutral Extreme Down Day on 18th as BankNifty confirmed the end of the upside imbalance by forming a lower low and also left a selling extension handle at 46028 which meant that the sellers were back in business and they caused a big gap down open of 486 points on 20th Sep forming a long liquidation ‘b’ shape profile with the dPOC at 45347 and remained below it on the 21st where it left another sell side handle at 45039 forming a DD down while negating the FA of 44812 and continued to hit lower lows till the 27th of Sep leaving couple of more daily VPOCs at 45137 & 44838 on 21st & 25th respectively as the downmove signalled a pause with the confirmation of a FA at 44182 but the bounce higher from this FA resulted in another FA at 44756 the very next day closing the month with a 3-day balance with a prominent POC at 44607.

The Monthly profile as was expected for September is an elongated one with a range of 2480 points with an initiative buying tail from 44182 to 43830 which had almost completed the 3 IB objective of 46345 as it stalled at the swing reference of 46310 and left a SOC (Scene Of Crime) at 46028 marking the reversal of the probe to the downside and went on to drop back to 44182 leaving overlapping to higher Value at 44152-44470-45438 with the 2 FAs of 44182 & 44756 being the immediate references on either side as we start the new month of October.
Monthly Zones
- The settlement day Roll Over point (October 2023) is 44595
- The VWAP & POC of Sep 2023 Series is 44438 & 44808 respectively
- The VWAP & POC of Aug 2023 Series is 44493 & 44550 respectively
- The VWAP & POC of Jul 2023 Series is 45414 & 45075 respectively
- The VWAP & POC of Jun 2023 Series is 43966 & 43986 respectively
- The VWAP & POC of May 2023 Series is 43660 & 43700 respectively
- The VWAP & POC of Apr 2023 Series is 41930 & 42190 respectively
