Order Flow charts dated 26th October 2020

Trading Order Flow allows a trader to see the specific price where a trade has hit the market, along with the volume of that trade. This information is extremely valuable and allows a trader to generate substantial revenue by using this information to trade. The way we see it is that Order Flow trading is […]
Market Profile Analysis dated 23rd October 2020

Nifty Oct F: 11934 [ 11980 / 11908 ] NF formed a hat-trick of Neutal Days as it continued to fill up the less auctioned zone of the Wednesday’s 250 pointer bar forming a nice 3-1-3 profile with higher Value but with the lowest daily range of this series of just 72 points as it currently […]
Weekly charts (19th to 23rd October 2020) and Market Profile Analysis

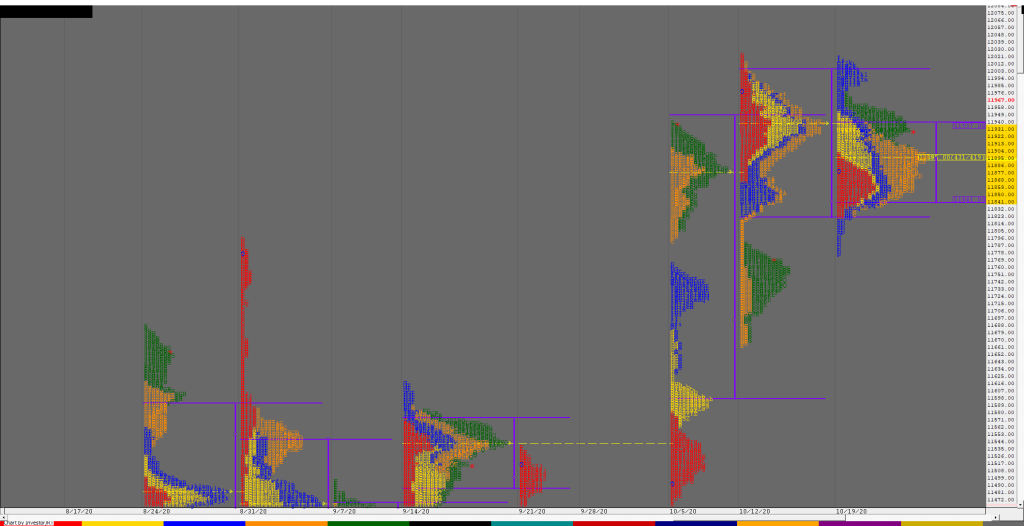
Nifty Spot Weekly Profile (19th to 23rd Oct) Spot Weekly – 11930 [ 12018 / 11776 ] Previous week’s report ended with this ‘The weekly profile looks like a developing DD (Double Distribution) as Nifty gave a move away from the 3-day balance and the composite POC of 11937 it was forming with a small […]
Order Flow charts dated 23rd October 2020 (5 mins)

Order Flow trading is thinking about what order market participants do and when you think along this, you can anticipate what kind of action they will be taking in the market. This is a very important concept in Order Flow. NF BNF
Order Flow charts dated 23rd October 2020

Many traders are used to viewing volume as a histogram beneath a price chart. This approach shows the amount of volume traded below the price Bar. The Order Flow approach is to see the Volume traded inside or within the price bar, an important distinction. Order Flow trading is thinking about what order market participants […]
Market Profile Analysis dated 22nd October 2020

Nifty Oct F: 11898 [ 11935 / 11827 ] NF opened lower and remained below the late PBH (Pull Back High) of 11949 all day forming a balanced profile in previous day’s low volume zone as it confirmed an inside bar both in terms of Range as well as Value leaving a narrow 107 point range […]
Order Flow charts dated 22nd October 2020

A good trader is a one who can make money consistently over a longer period of time. But how to become one such trader, who can make money in any type of market condition? A good trader keeps a close watch on the current information of the market and assesses it for change against previous […]
Market Profile Analysis dated 21st October 2020

Nifty Oct F: 11927 [ 12017 / 11767 ] NF opened higher much above the yPOC of 11893 and gave an Open Drive on just about average volumes as it took out previous week’s Trend Day high of 11999 & the swing high of 12003 in the IB as it hit 12006 but once again stalled […]
Order Flow charts dated 21st October 2020

Many traders are looking for information on how to use market conditions to find good trades. Order Flow is best understood as a way to see existing bias in the markets. Order Flow helps us understand who is in control of the market and who is ‘upside down’ and likely to make exits from that […]
Market Profile Analysis dated 20th October 2020

Nifty Oct F: 11896 [ 11945 / 11831 ] NF opened lower but was swiftly rejected from 11831 as it got back into previous day’s Value as it not only completed the 80% Rule in the ‘A’ period but scaled above PDH (Previous Day High) to hit 11918 after which it formed an inside bar […]
