Market Profile Analysis dated 17th Mar 2020
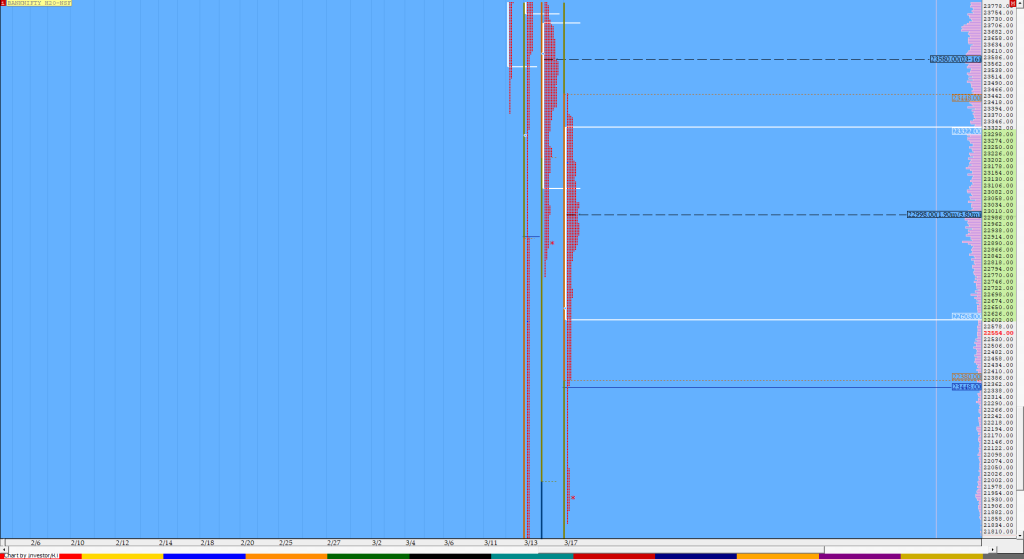
Nifty Mar F: 8915 [ 9358 / 8851 ] HVNs – (8680) / (8900) / (9110-120) / 9200 / 9380 / [9425] / (9530) / 9680 / 9740 / 9900 / 9950 / 10450 / 10544 NF opened with a first gap up in 7 days of more than 100 points which was promptly sold […]
Order Flow charts dated 17th Mar 2020

A good trader is a one who can make money consistently over a longer period of time. But how to become one such trader, who can make money in any type of market condition? A good trader keeps a close watch on the current information of the market and assesses it for change against previous […]
Order Flow charts dated 17th Mar 2020 (5 mins)

Order Flow is the most transparent way to trade and takes away the guesswork from decision making. NF BNF
Market Profile Analysis dated 16th Mar 2020
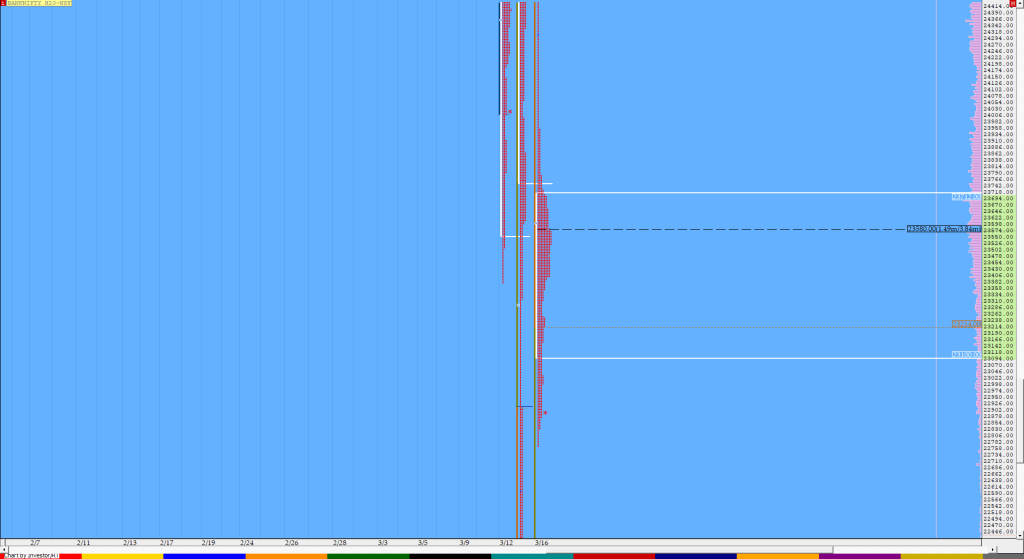
Nifty Mar F: 9118 [ 9570 / 9055 ] HVNs – (8680) / (9120) / 9380 / [9425] / (9530) / 9680 / 9740 / 9900 / 9950 / 10450 / 10544 NF opened lower with a big gap down of 380 points and stayed below Friday’s VWAP of 9550 which was a sign that […]
Market Profile Analysis dated 13th Mar 2020
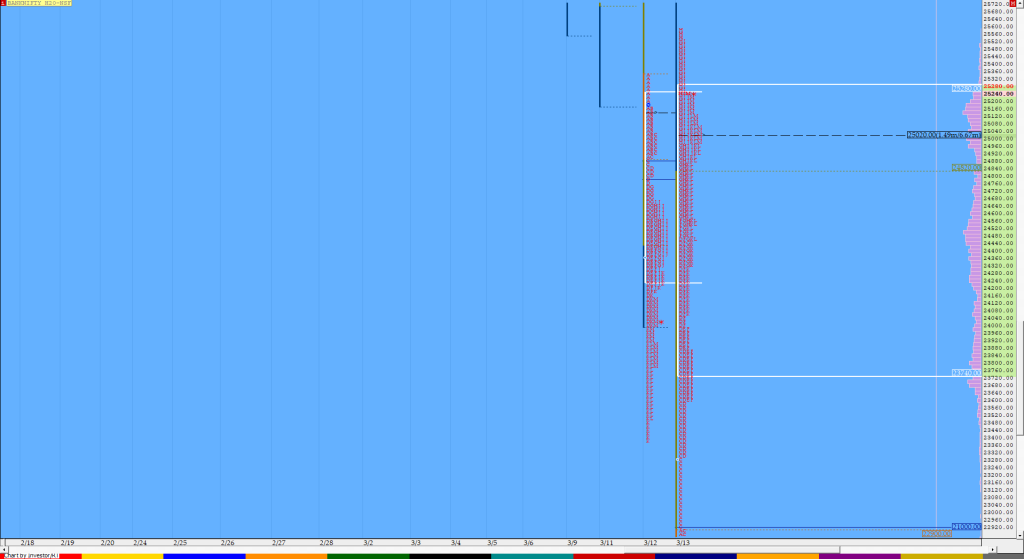
Nifty Mar F: 9898 [ 10130 / 8299 ] HVNs – (8680) / [9425] / (9530) / 9680 / 9740 / 9900 / 9950 / 10450 / 10544 / 10911 Report to be updated… The NF Open was an Open Auction Out of Range (OAOR) The day type was a Trend Day – Up Largest volume […]
Order Flow charts dated 16th Mar 2020

Many traders are looking for information on how to use market conditions to find good trades. Order Flow is best understood as a way to see existing bias in the markets. Order Flow helps us understand who is in control of the market and who is ‘upside down’ and likely to make exits from that […]
Order Flow charts dated 16th Mar 2020 (5 mins)

Vtrender helps you to stay on top of the Market by understanding Order Flow. This increases your flexibility, your data analysis capability and your winning trade signals. And you make your existing systems better. NF BNF
Weekly charts (09th to 13th Mar 2020) and Market Profile Analysis
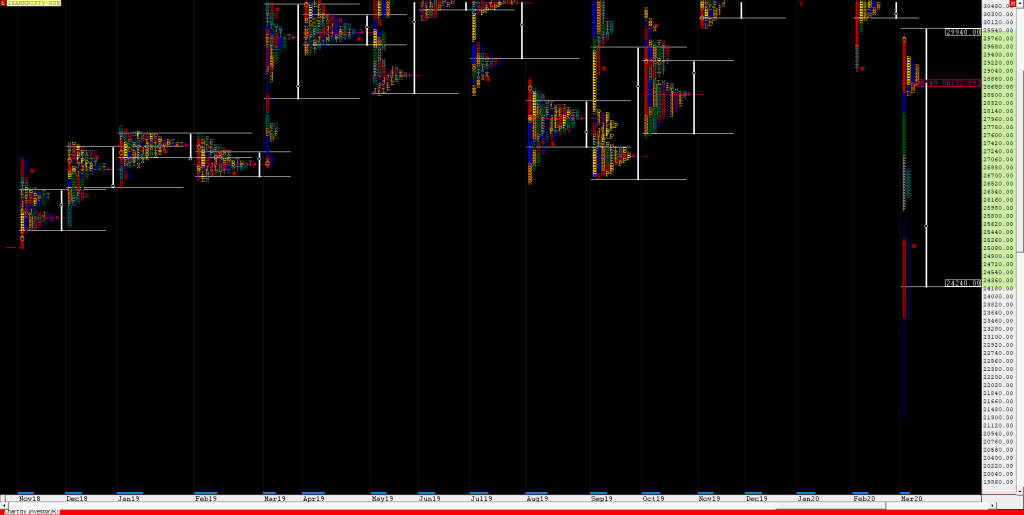
Nifty Spot Weekly Profile (09th to 13th Mar 2020) Spot Weekly – 9955 [ 10751/ 8555 ] Previous week’s ended with this ‘the PLR remains to the downside for a test of 10746 / 10670 & 10600 which if broken can bring more downside.’. Nifty opened this week with a big gap down of almost […]
Order Flow charts dated 13th Mar 2020

Many traders are used to viewing volume as a histogram beneath a price chart. This approach shows the amount of volume traded below the price Bar. The Order Flow approach is to see the Volume traded inside or within the price bar, an important distinction. Order Flow trading is thinking about what order market participants […]
Order Flow charts dated 13th Mar 2020 (5 mins)

Market participants always look for the weaker side of the market, so both buy and sell stops will be targeted. Just one of the many concepts of Order Flow trading. NF BNF
