Order Flow charts dated 07th October 2020

When we think about how to measure volume in the market one of the keys is Order Flow. It plays a role by telling us what the other traders have done in the market and are currently doing and this provides valuable clues and potential opportunities to trade. An Order Flow trader can actually see […]
Market Profile Analysis dated 06th October 2020
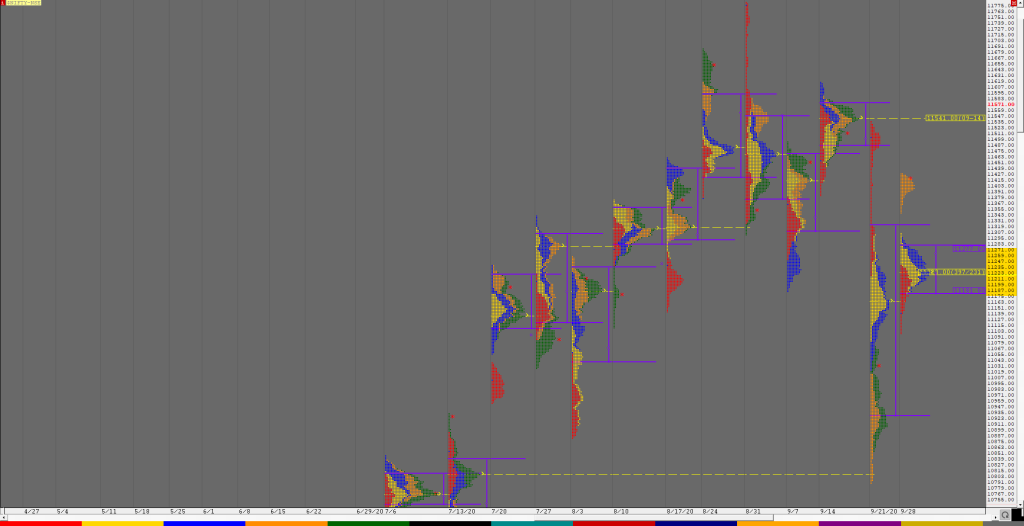
Nifty Oct F: 11670 [ 11685 / 11566 ] NF negated the upside tail of previous day’s profile as it opened with a gap up of 65 points and probed above PDH and went on to make new highs for the series at 11604 in the IB (Initial Balance) where it made a very narrow […]
Order Flow charts dated 06th October 2020

Timing is the key to successfully trade the markets in the shorter time frame. Order Flow is one of the most effective methods to time your trades by seeing exactly what the other traders are trading in the market and positioning your bias accordingly. Order Flow is the most transparent way to trade and takes […]
Market Profile Analysis dated 05th October 2020

Nifty Oct F: 11517 [ 11588 / 11450 ] NF continued the imbalance to the upside it had started in the previous session as it opened above PDH (Previous Day High) and drove higher as it first tagged the VPOC of 11508 from 21st Sep and then got into the weekly balance of 14th to […]
Order Flow charts dated 05th October 2020

The key to using Order Flow trading is to determine market depth. This describes the places where Market participants have taken positions or the zone they have transacted. The Order Flow is like a list of trades and helps to know how other traders are placed in the market. Vtrender helps you to stay on […]
Market Profile Analysis dated 01st October 2020

Nifty Oct F: 11435 [ 11447 / 11344 ] NF moved away from the 3-day composite as it opened with a 100 point gap up and made a slow probe higher gaining acceptance in the selling tail of 11343 to 11422 as it hit 11447 leaving a ‘p’ shape profile for the day and closed […]
Weekly charts (28th September to 01st October 2020) and Market Profile Analysis
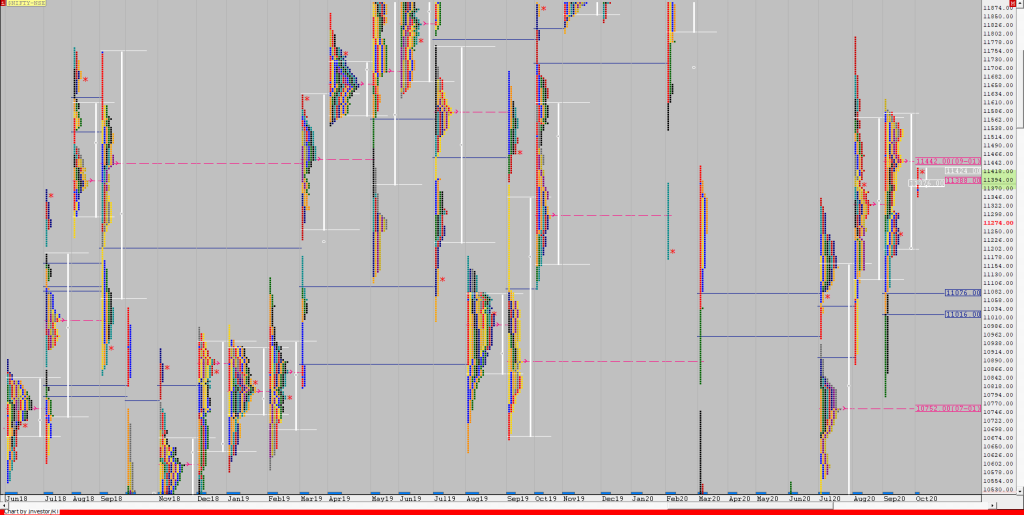
Nifty Spot Weekly Profile (28th Sep to 01st Oct 2020) Spot Weekly – 11050 [ 11535 / 10790 ] Previous week’s report ended with this ‘The weekly profile resembles a Triple Distribution Down over a big range of 745 points with Value completely lower at 10929-11163-11319. Nifty could attempt to fill up the low volume […]
Monthly (September 2020) charts and Market Profile Analysis
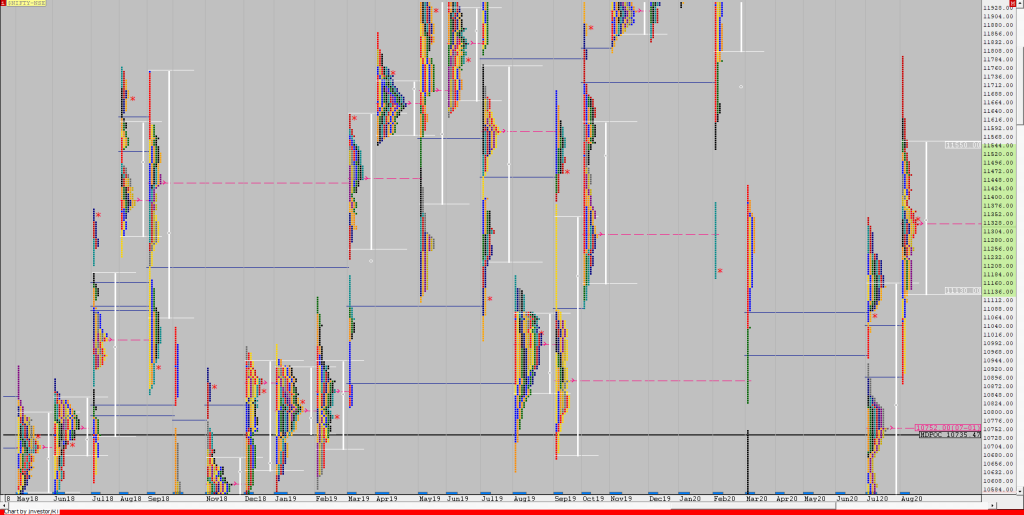
Nifty Spot – 11247 [ 11618 / 10790 ] Monthly Profile (September 2020) Previous month’s report ended with this ‘Value for the month was higher at 11130-11311-11550 and has rejections at both ends with the selling tail being from 11617 to 11794 which would be the supply zone for the coming month. On the downside, […]
Order Flow charts dated 01st October 2020

Trading Order Flow allows a trader to see the specific price where a trade has hit the market, along with the volume of that trade. This information is extremely valuable and allows a trader to generate substantial revenue by using this information to trade. The way we see it is that Order Flow trading is […]
Market Profile Analysis dated 30th September 2020
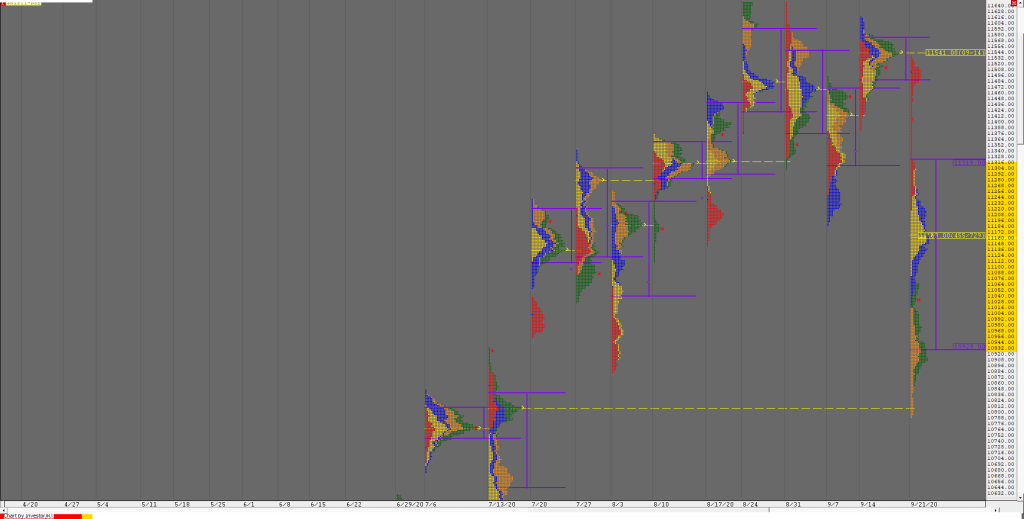
Nifty Oct F: 11257 [ 11295 / 11195 ] NF made an OAIR start and remained in previous day’s range all day to leave an inside bar on the daily as it made multiple rounds of the 80% Rule in previous Value and in the process formed overlapping to higher Value for the second consecutive […]
