Order Flow charts dated 23rd June 2020

When we think about how to measure volume in the market one of the keys is Order Flow. It plays a role by telling us what the other traders have done in the market and are currently doing and this provides valuable clues and potential opportunities to trade. An Order Flow trader can actually see […]
Order Flow charts dated 23rd June 2020 (5 mins)

An Order Flow trader can actually see exactly what is happening in the market as it happens. Once you are able to understand what is happening in the present, you are able to make far better decisions about what might happen in the future. Order Flow provides traders with vision into market activity. NF BNF
Market Profile Analysis dated 22nd June 2020
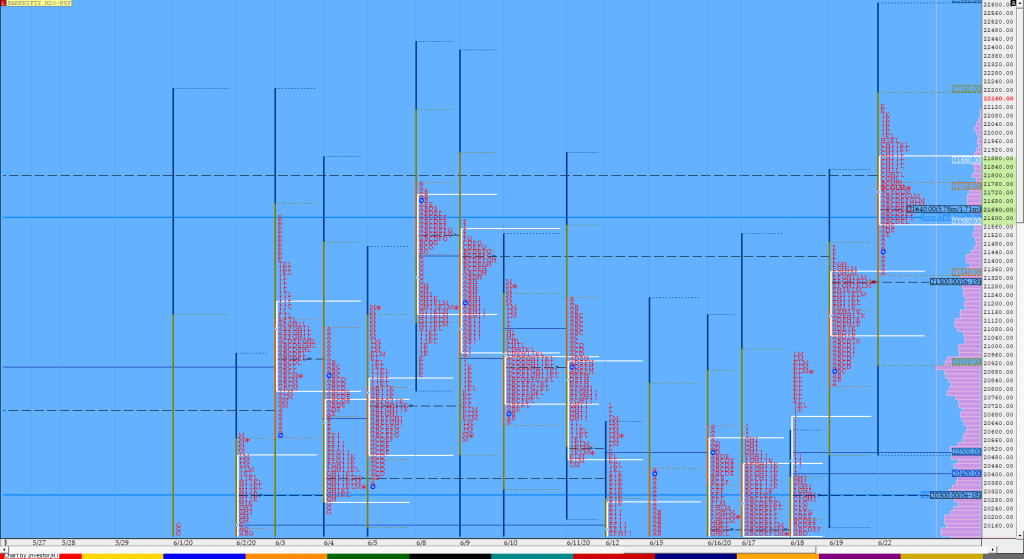
Nifty Jun F: 10288 [ 10375 / 10236 ] HVNs – 9093 / 9275 / 9433 / 9785 / 9894 / 10064 / 10094 / 10140 / 10260 NF opened in the spike zone & moved higher giving a 111 point move in the Initial Balance as it made new highs for this series at […]
Order Flow charts dated 22nd June 2020

Timing is the key to successfully trade the markets in the shorter time frame. Order Flow is one of the most effective methods to time your trades by seeing exactly what the other traders are trading in the market and positioning your bias accordingly. Order Flow is the most transparent way to trade and takes […]
Order Flow charts dated 22nd June 2020 (5 mins)

Order Flow is the most transparent way to trade and takes away the guesswork from decision making. NF BNF
Market Profile Analysis dated 19th June 2020
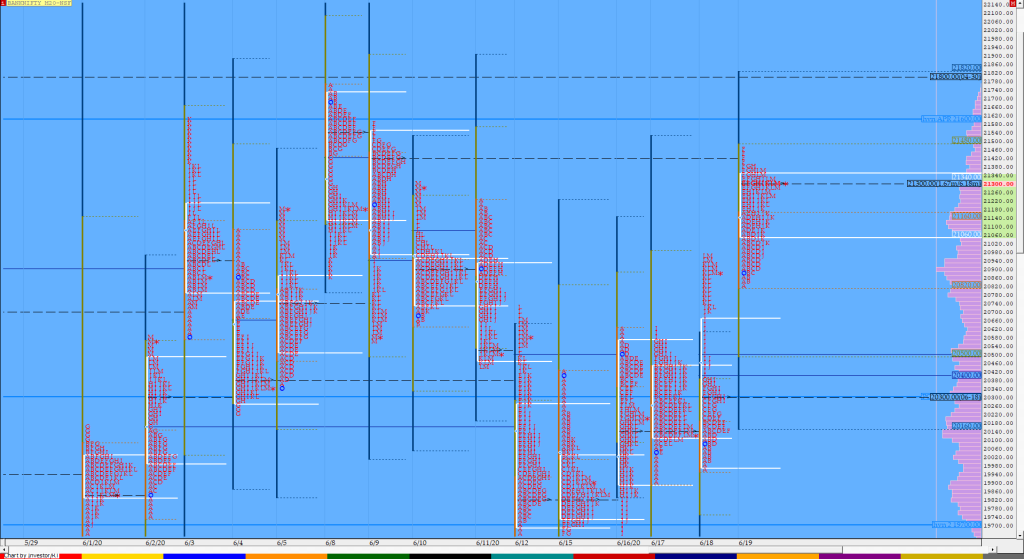
Nifty Jun F: 10235 [ 10252 / 10051 ] HVNs – 9093 / 9275 / 9433 / 9785 / 9894 / 10064 / 10094 / 10140 / 10260 Previous day’s report ended with this ‘The profile has couple of extension handles at 9980 & 10008 plus a spike close of 10032 to 10104 and the spike […]
Weekly charts (15th to 19th June 2020) and Market Profile Analysis
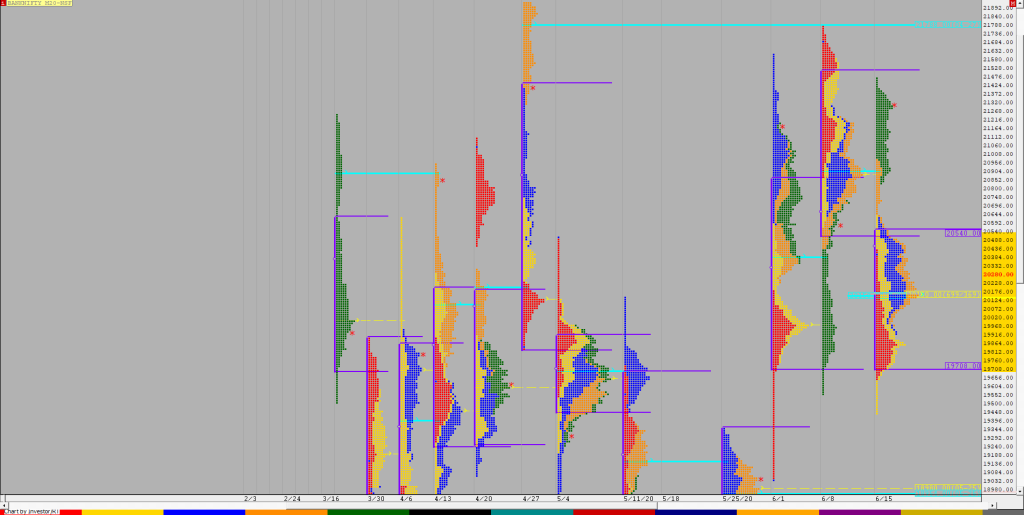
Nifty Spot Weekly Profile (15th to 19th June 2020) Spot Weekly – 10244 [ 10272 / 9726 ] Previous week’s report ended with this ‘On the daily front, we have a nice 7-day composite from 3rd to 11th June with Value at 10002-10109-10181 so entry into this Value in the coming week could trigger the […]
Order Flow charts dated 19th June 2020

The key to using Order Flow trading is to determine market depth. This describes the places where Market participants have taken positions or the zone they have transacted. The Order Flow is like a list of trades and helps to know how other traders are placed in the market. Vtrender helps you to stay on […]
Order Flow charts dated 19th June 2020 (5 mins)

Vtrender helps you to stay on top of the Market by understanding Order Flow. This increases your flexibility, your data analysis capability and your winning trade signals. And you make your existing systems better. NF BNF
Market Profile Analysis dated 18th June 2020
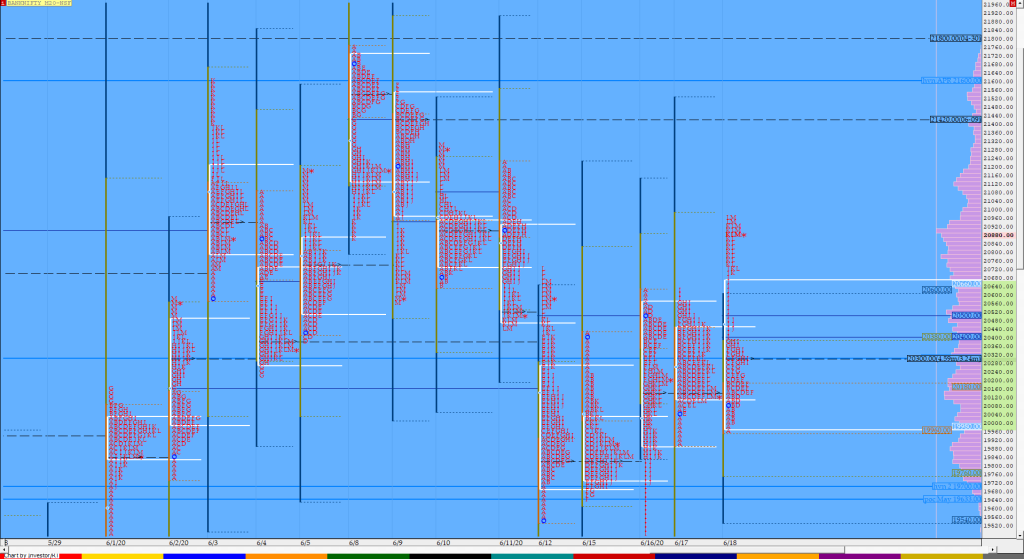
Nifty Jun F: 10072 [ 10104 / 9825 ] HVNs – 9093 / 9275 / 9433 / 9785 / 9894 / 10064 / 10094 / 10140 / 10260 Previous day’s report ended with this ‘The auction could be gearing up for a move away from this zone in the coming sessions and the references on the […]
