Nifty Spot Weekly Profile (20th to 24th Apr 2020)
Spot Weekly – 9154 [ 9391 / 8909 ]
Previous week’s report ended with this ‘The range for this week was a mere 502 points which was the lowest in 7 weeks with an overlapping & prominent POC around 9000 and a range expansion could be expected in the coming week(s).‘
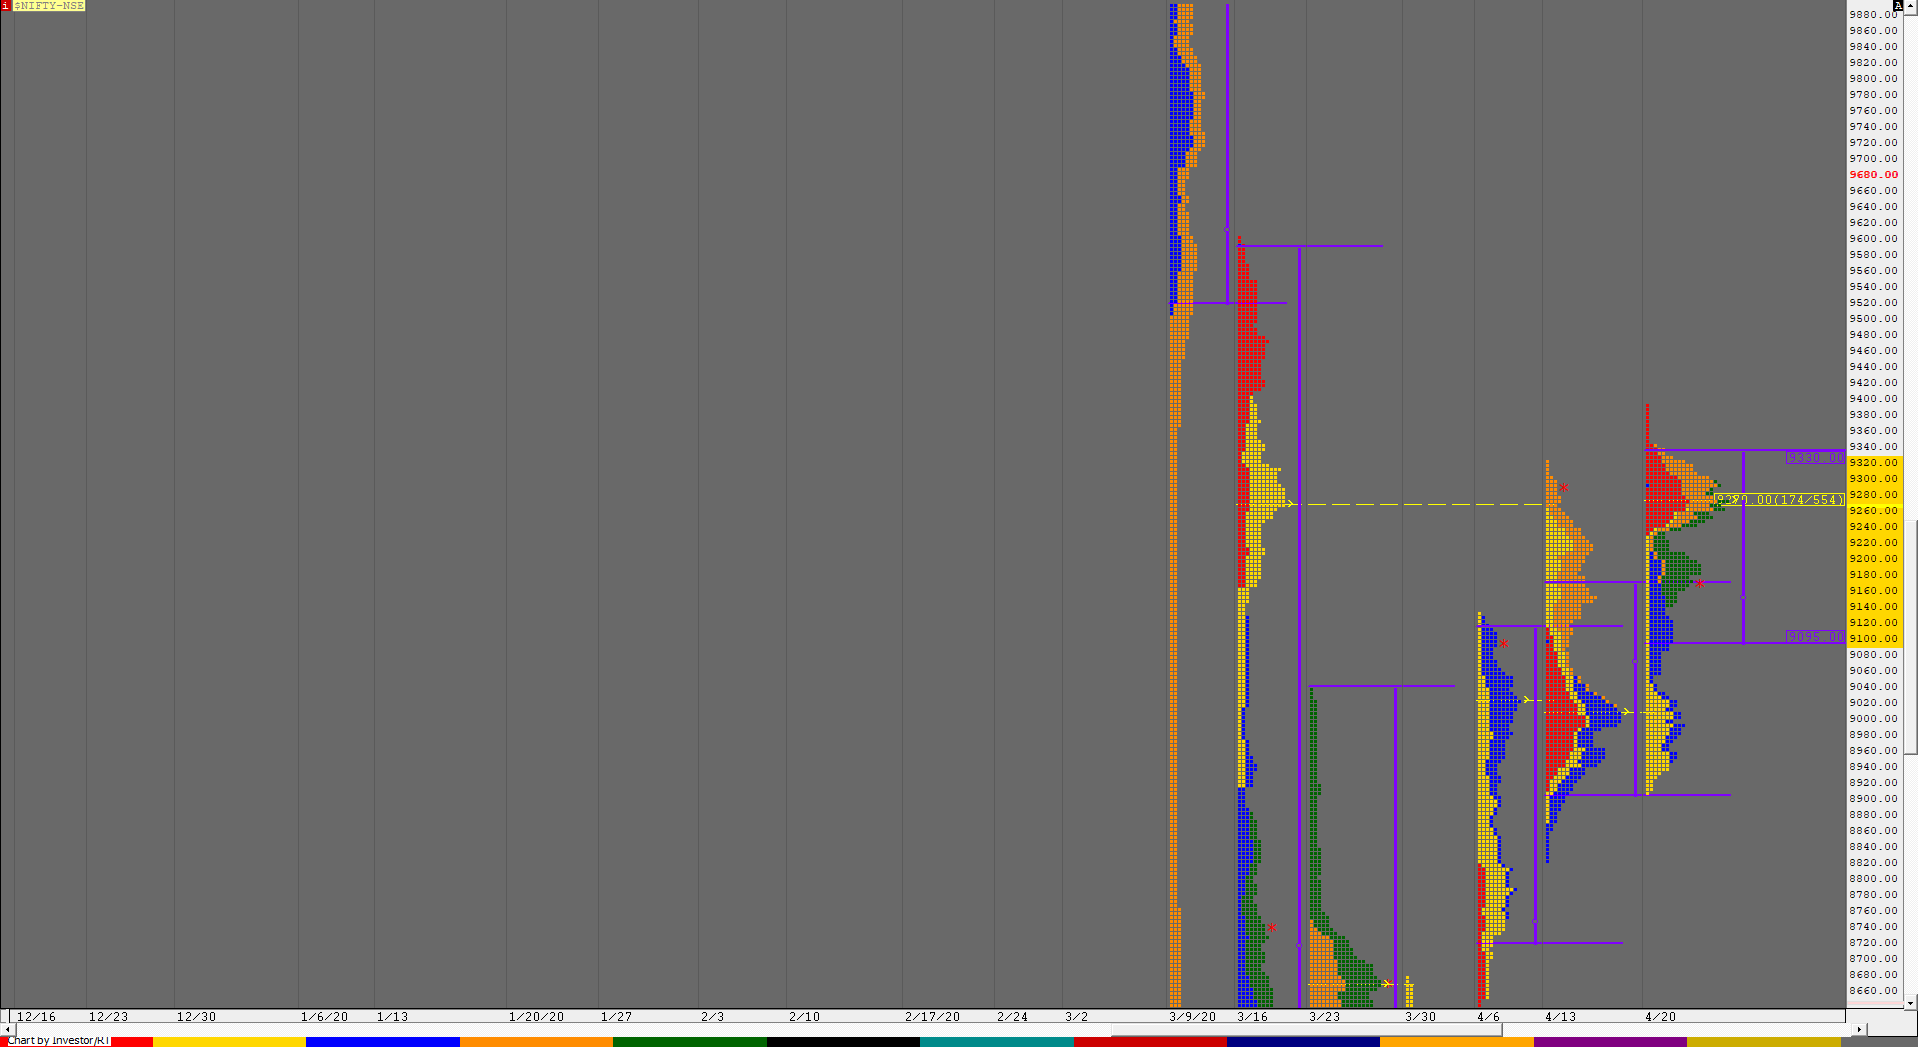
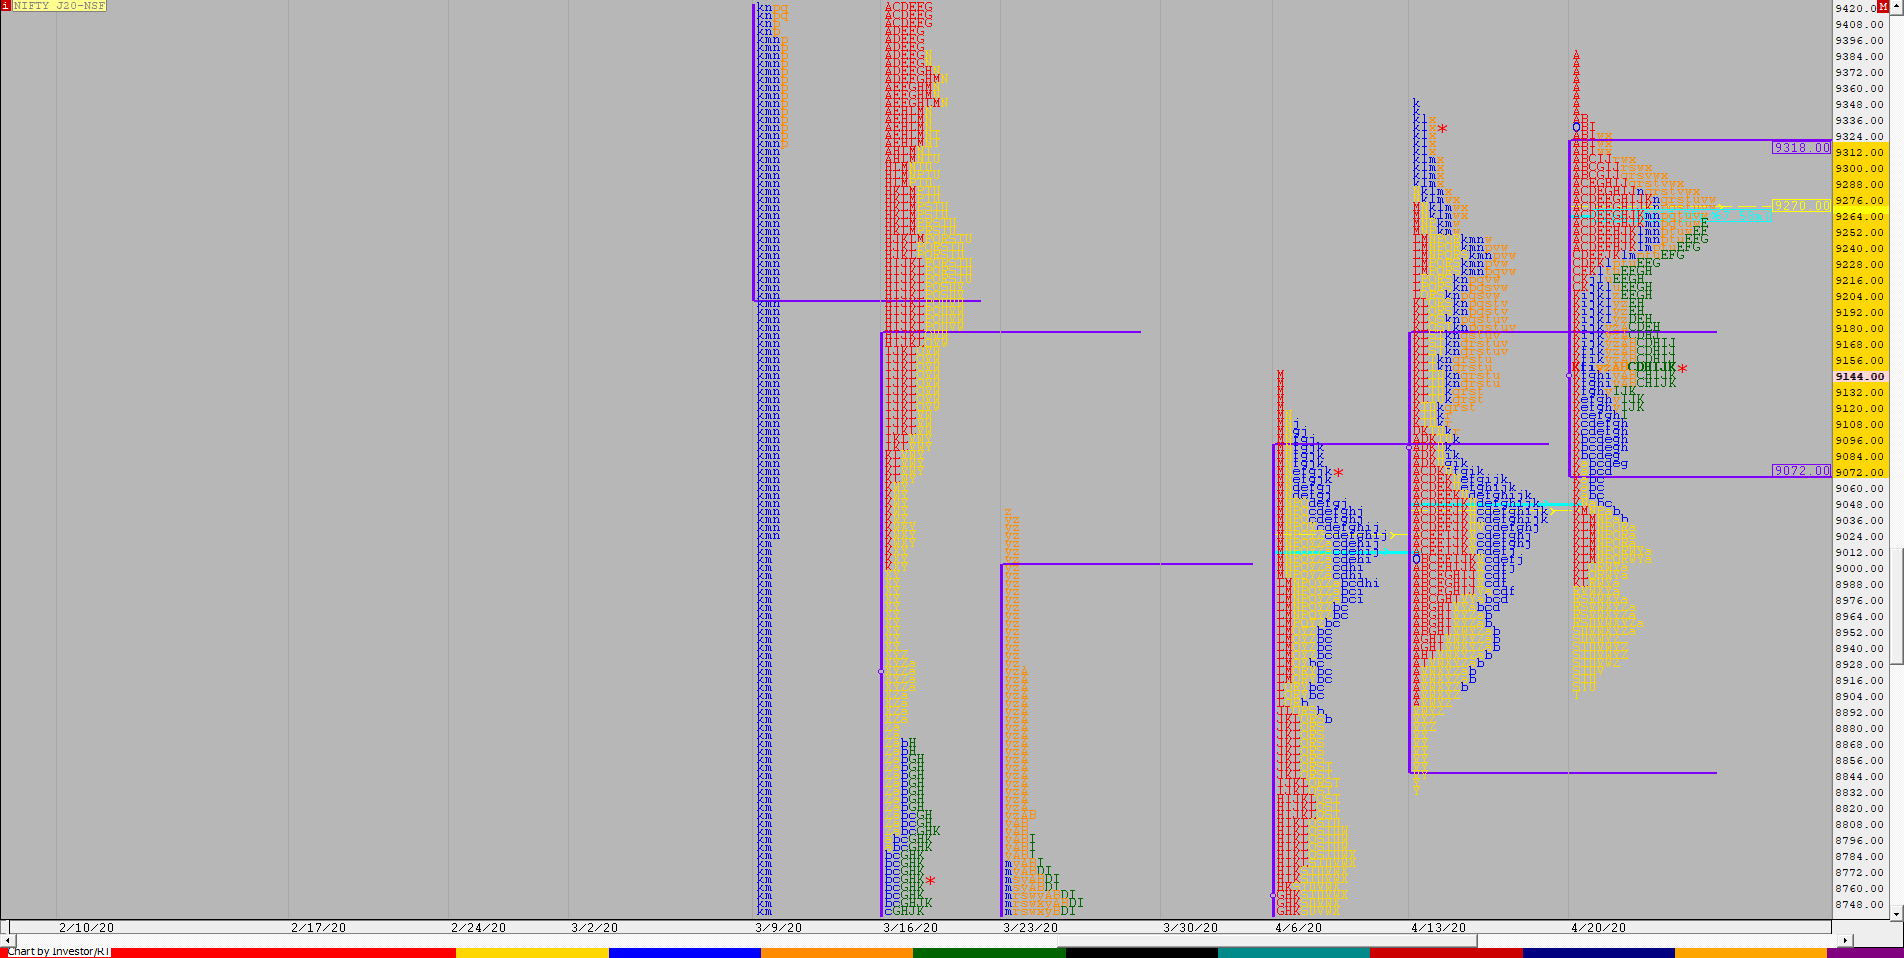
Nifty opened this week with a gap up making a freak OH (Open=High) tick of 9391 which was the base of the selling tail of 17th March where we also have the positional reference of the FA (Failed Auction) of 9403. The auction made a ‘b’ shape profile for the day with lows of 9231 along with a prominent POC at 9271 but had left an important excess at highs from 9342 to 9391 which was a sign that the upside was stalling though the day’s range was completed above the weekly Value. Nifty then opened with a big gap down of 245 points on Tuesday right in that 4-day composite it had made from 9th to 16th April (Click here to view the MPLite chart) and completed the 80% Rule in the Value of the composite while making lows of 8909 getting support just above the weekly VAL which meant that the downside probe was getting exhausted as it closed the day at 8981. Wednesday saw the IB (Initial Balance) continue to balance in previous day’s Value but the ‘C’ period gave an extension handle not just on the daily but also on the weekly at 9044 which led to a trending move higher as the auction went on to scale above the weekly VAH and made a high of 9210. This imbalance continued on Thursday as Nifty went on to close the gap and made highs of 9343 getting stopped right at that selling tail it had left on Monday indicating supply was still persisting in this zone and the auction reacted with a gap down of 150 points on Friday but took support at 9145 which was also the VWAP of March and made a quick probe higher to 9228 in the IB after which it started to form a balance for the first half of the day and left a PBL (Pull Back Low) at 9163 which was just above the weekly VAL. Nifty then made a late RE to the upside in the ‘G’ period and followed it up with a higher high of 9297 in the ‘H’ period but could not tag the previous day’s POC at 9311 which led to a big reversal resulting in a new day low of 9141 being made at close before the auction closed the week at 9154 which was right in middle of this week’s Value of 9095-9270-9330 which was overlapping to higher. The range for this week was a mere 481 points making it the narrowest in 8 weeks and with the selling tail at top on the weekly profile, the PLR for the coming week seems to be down with the VPOC of 9106 & the extension handle of 9044 being the immediate support levels and on the upside, the HVN of 9270 could act a tough resistance.
Click here to view this week’s auction in Nifty with respect to previous week’s profile on MPLite
Main Weekly Hypos for Nifty (Spot):
A) Nifty needs to sustain above 9145 for a probe to 9175 / 9209-28 / 9270 / 9311*-43 & 9404
B) The auction has immediate support at 9121-9106* below which it could test lower levels of 9073 / 9044-13 / 8978 / 8939-12 & 8887
Extended Weekly Hypos
C) If 9404 is taken out, Nifty can probe higher to 9441*-58 / 9491-9507 / 9556-65 / 9602 & 9655
D) Break of 8887 could bring lower levels of 8836 / 8790-48* / 8700 / 8649 & 8599-92
-Additional Hypos`-
E) Above 9655`, Nifty could start a new leg up to 9702 / 9733-52 / 9801-50 / 9906 & 9950-61
F) Below 8592`, the auction can fall further to 8510-8499 / 8445* / 8413 /8394-63 & 8325
NF (Weekly Profile)
9138 [ 9385 / 8909 ]
NF started this week with a test of that positional FA point of 9385 on Monday morning from where it was swiftly rejected as it went on to confirm a selling tail from 9337 to 9385 not just on the daily but the weekly profile as well and ended up the day with a ‘b’ shape profile with lows of 9215. The auction opened with a huge gap down on Tuesday and got stalled at the weekly POC of 9042 after which it continued to go down and made a low of 8909 before it closed the day higher at 8972. NF then trended higher for the next 2 days filling up the gap zone as it made a high of 9328 on Thursday afternoon stalling right below that selling tail of Monday which signaled the end of the probe to the upside as it closed around the prominent POC of 9289 and gave a gap down open on Friday which ended up as a Neutral day forming a balance between the 2 daily VPOCs of 9102 and 9289. This week’s Value was overlapping to higher at 9072-9270-9318 and the auction could be filling up the low volume zone of 9030 to 9270 in the coming week before making the next initiative move away.
BankNifty Spot Weekly Profile (20th to 24th Apr 2020)
Spot Weekly – 19586 [ 21122 / 19052 ]
Previous week’s report ended with this ‘…the zone from 20184 to 20866 being the immediate reference and within that 20447 being the important level to watch. This week’s Value was overlapping to higher at 19188-19884-20124.’
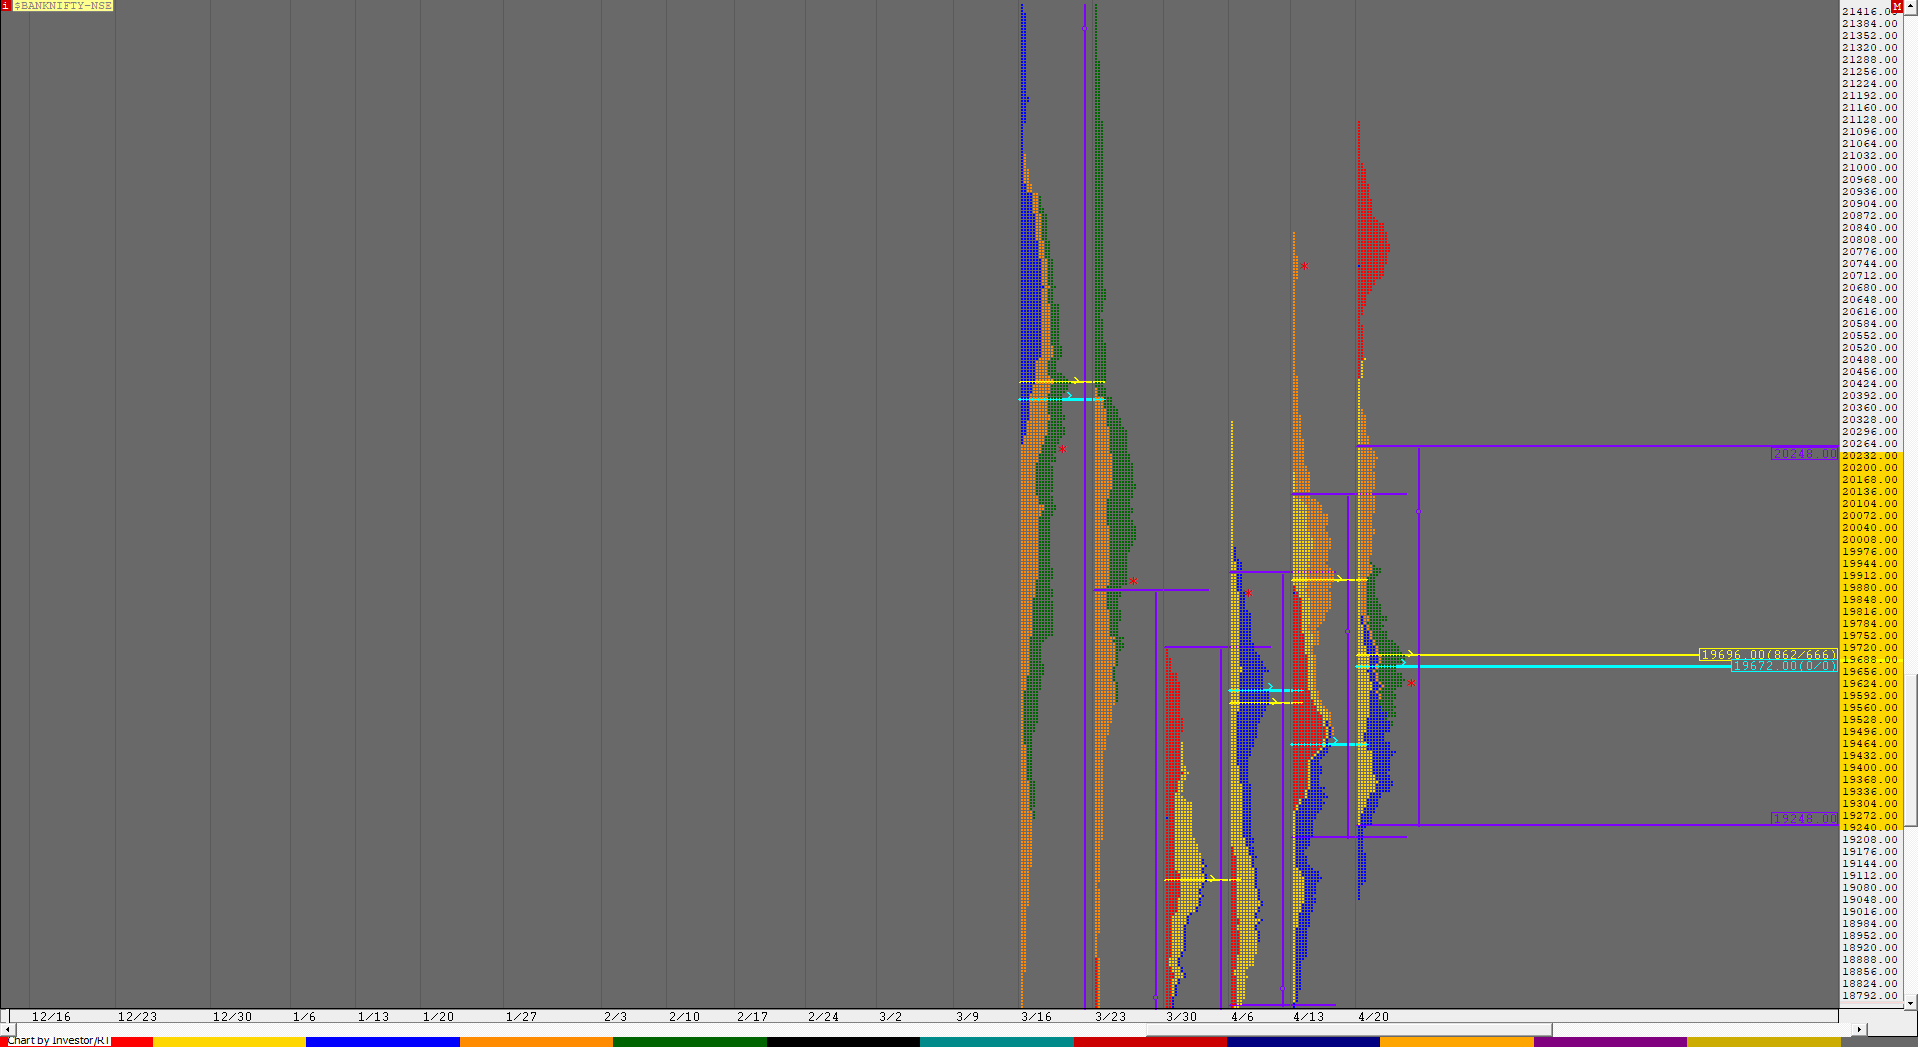
BankNifty opened the week with a gap up of 423 points but similar to Nifty confirmed an almost OH start at 21105-21122 after which it probed lower leaving a selling tail from 21008 to 21122 going back into previous week’s range confirming a rejection at these new highs as it formed a ‘b’ shape profile for most part of the day before spiking lower into the close while testing the important level of 20447 before closing the day at 20522. The auction then opened with a big gap down of 710 points on Tuesday right in the middle of previous week’s Value & continued to probe towards the weekly VAL as it made lows of 19247 and continued the leg down on Wednesday too in form of another gap down after which it went on to make lows of 19052 in the IB (Initial Balance) and seemed to be taking support at the VAL of the 5-day composite it had formed from 9th to 16th April. (Click here to view the MPLite chart) More confirmation that the downside probe was over came in the form of mutiple REs on the upside as BankNifty went on make a high of 19806 forming a nice 2-day Gaussian profile with a prominent POC at 19424 and the next day open saw the auction moving away from this Value as it continued to trend higher all day forming Value in the gap zone with a ‘p’ shape profile as it made highs of 20356 before closing the day around the monthly POC of 20248. Friday saw a gap down once again which was the 3rd one in the last 4 days as BankNifty stayed below the yPOC of 20164 but got stuck in a narrow range of just 435 points which was the lowest daily range from 27th Feb and ended up forming a balanced profile along with a Neutral Day as it closed at 19586. The weekly profile looks like a DD (Double Distribution) Down with a small balance at top which has a HVN at 20776 below which a zone of singles from 20612 to 20336 separates the large lower distribution having the HVN at 19672. Value for the week is at at 19248-19696-20248 which was mostly overlapping to higher compared to the previous week and the close was right at the POC of the 2-week composite (Click here to view the MP Lite chart) so a move away from here in the coming week(s) has a very good probability.
Main Weekly Hypos for Bank Nifty (Spot):
A) BankNifty needs to get above 19601 & sustain for a probe to 19676-741 / 19780-851 / 19932-950 / 20025-94 / 20164*-248 & 20303-375
B) The auction has immediate support at 19531 below which it could test 19460-424* / 19380-321 / 19248-171 / 19110-044 / 18976-960* & 18875-835
Extended Weekly Hypos
C) Above 20375, BankNifty can probe higher to 20445-450 / 20522-610 / 20665-708 / 20776* / 20860-880 & 20953-21008
D) Below 18835, lower levels of 18768-675 / 18595-565 / 18498-412 / 18272* & 18225-184 could come into play
-Additional Hypos*-
E) Above 21008`, BankNifty could start a new leg up to 21098-120 / 21171-245 / 21390-463 / 21515-555 & 21610-685
F) Below 18184`, the auction can go down to 18094-009 / 17954-890 / 17825-750 / 17680 / 17596* & 17510-490
BNF (Weekly Profile)
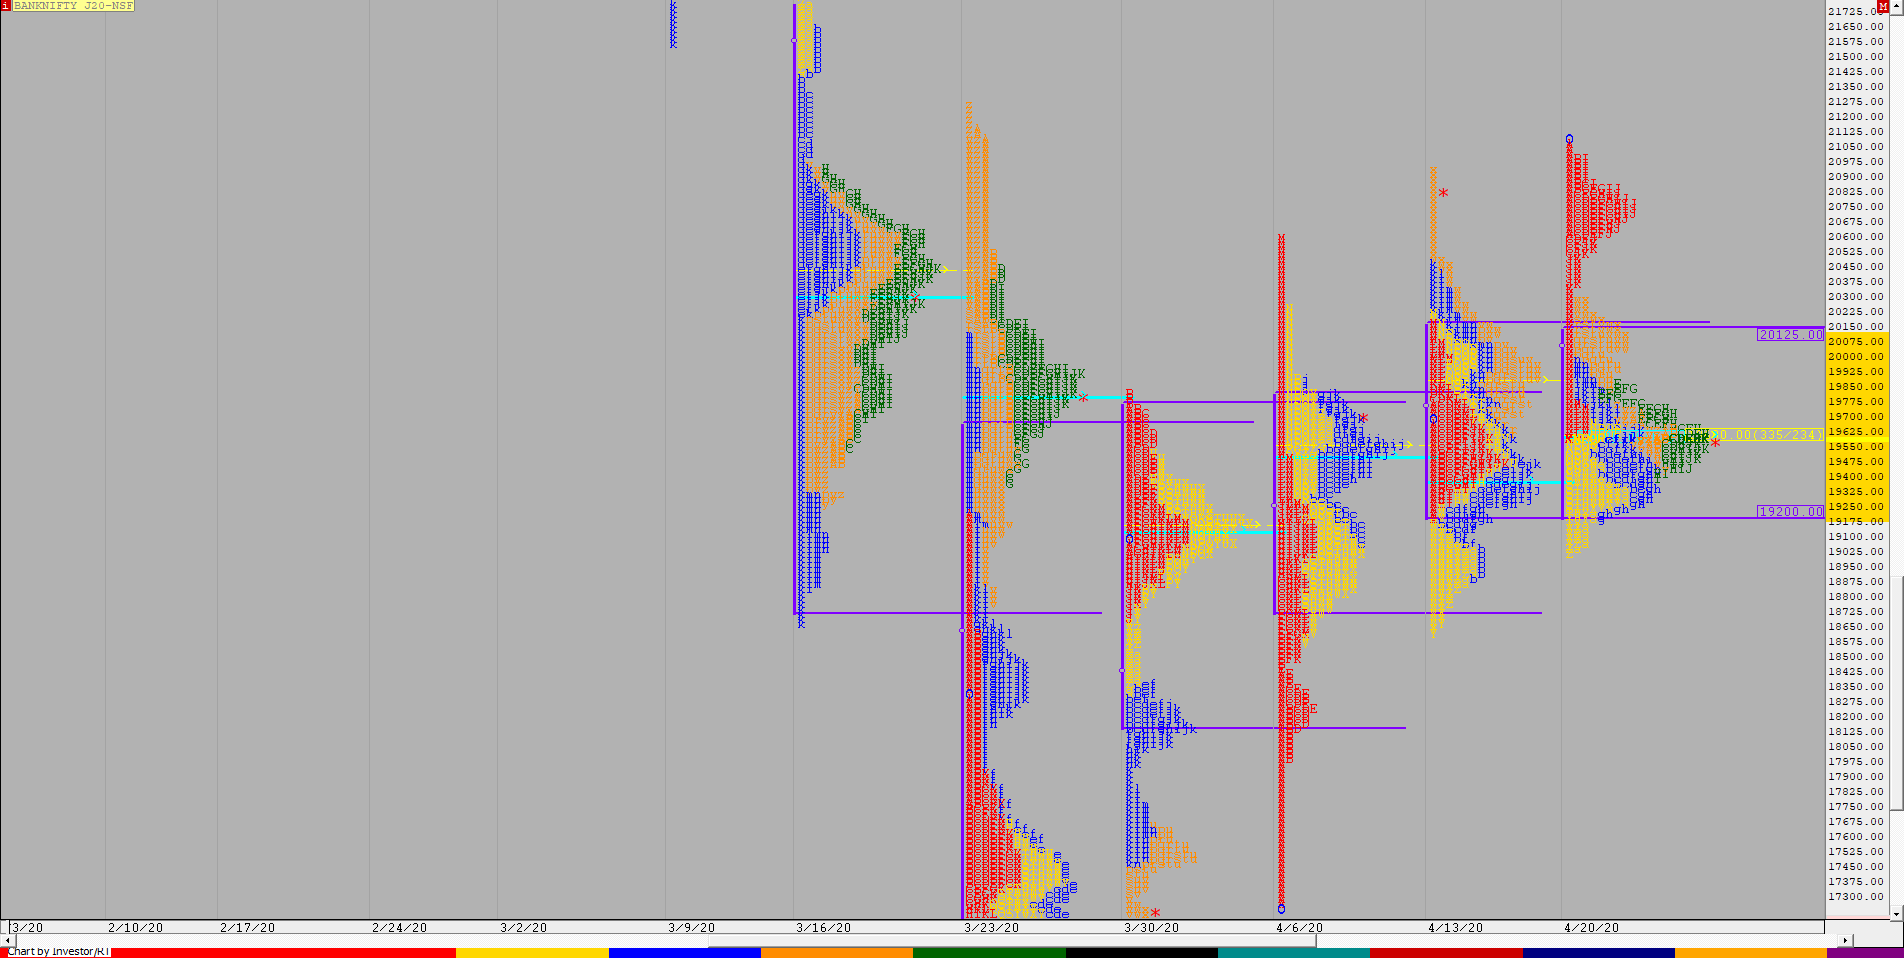
19517 [ 21100 / 19002 ]
BNF opened this week with a gap up above previous week’s Value & Range but was rejected right at the start after making an almost OH tick of 21087-21100 after which it not only got back into previous week’s range and Value completing the 80% Rule but remained in this Value all week as it formed almost similar Value this week too at 19200-19600-20125. We have a high volume cluster in the zone of 19400 to 19600 for this series and would need a high volume break away to move away from this zone else could continue to form a balance around this.


